Insights Reporting
Reports are available within the NEONNOW softphone as an Enterprise feature "Insights". This page provides an overview of the reports available.
NEONNOW Insights reporting are build using AWS's Quicksight reporting tool. This provides a rich set of reporting capabilities, including the ability to create custom reports. For more information on Quicksight, see the
Overview
There are three key reports groupings:
- Wallboard - a real-time, impactful report showing simple metrics for the contact centre
- Performance Today - a report showing key metrics for the current day in more detail, across both agent and queue views
- Analytics - reports focussing on historical contact centre performance over time, and across a range of metrics
Overriding Reports with Custom Reports
Any of the 3 out of the box reports can be overridden with a custom report. See your administrator to set this up.
Wallboard
The Wallboard dashboard is providing real time metrics based on a 15-second refresh rate so that the user has an in the moment view of what is happening in their call center. This includes breakdowns of queue statuses, available agents, and current, overall wait times.
It can be displayed in a contact centre on a large screen so all staff including floor walkers can view it.
To load the Wallboard report, select the Wallboard button on the left-hand taskbar:
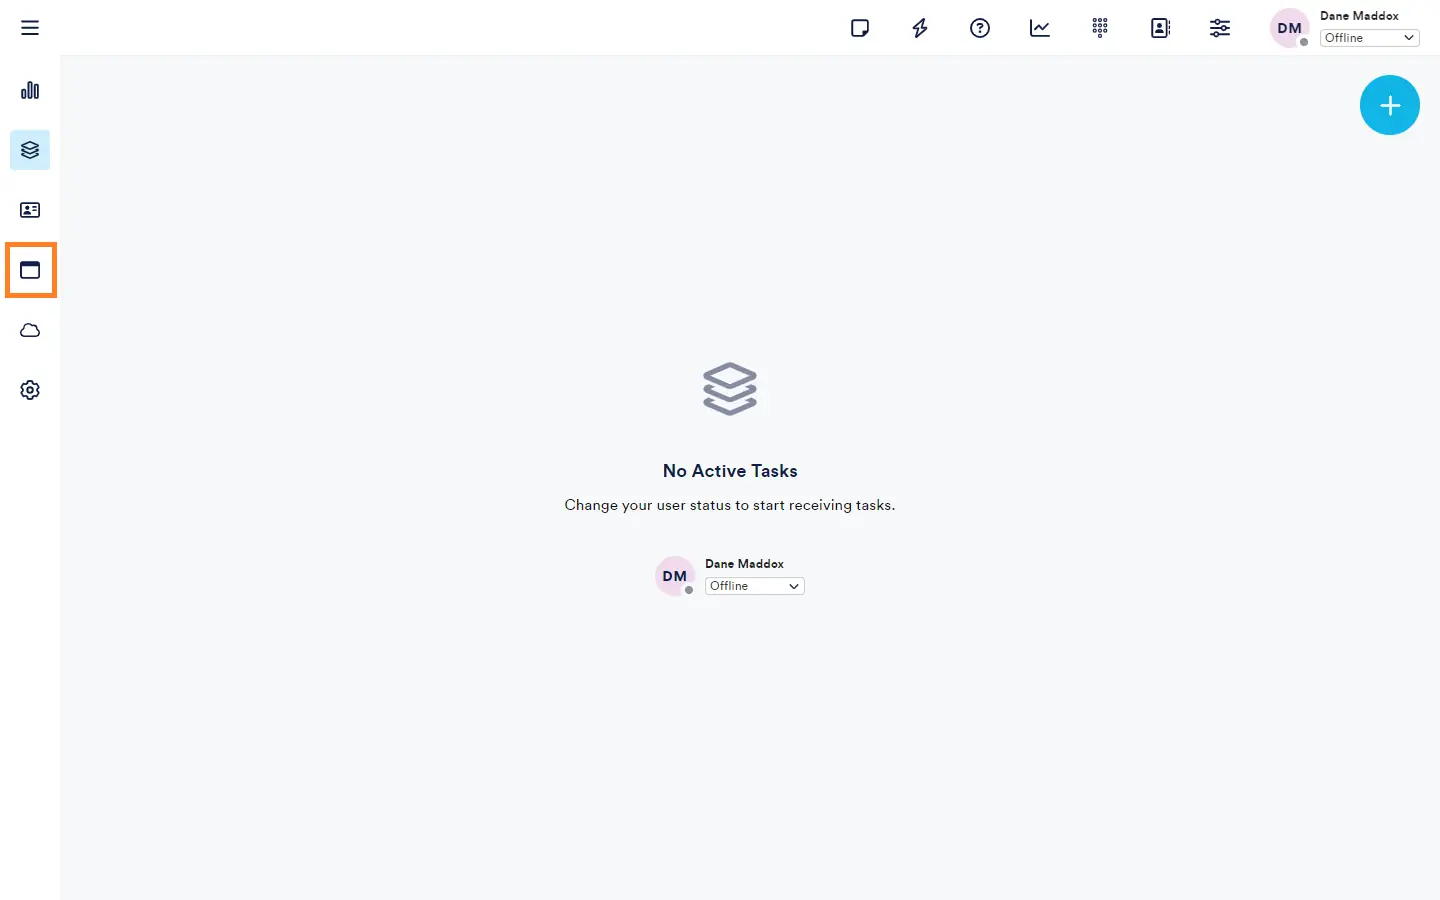
This will navigate to the Wallboard report:
The following provides an overview of the Wallboard Report elements and metrics. There are two tabs in the default Wallboard - 'Wallboard' and 'Service Level'.
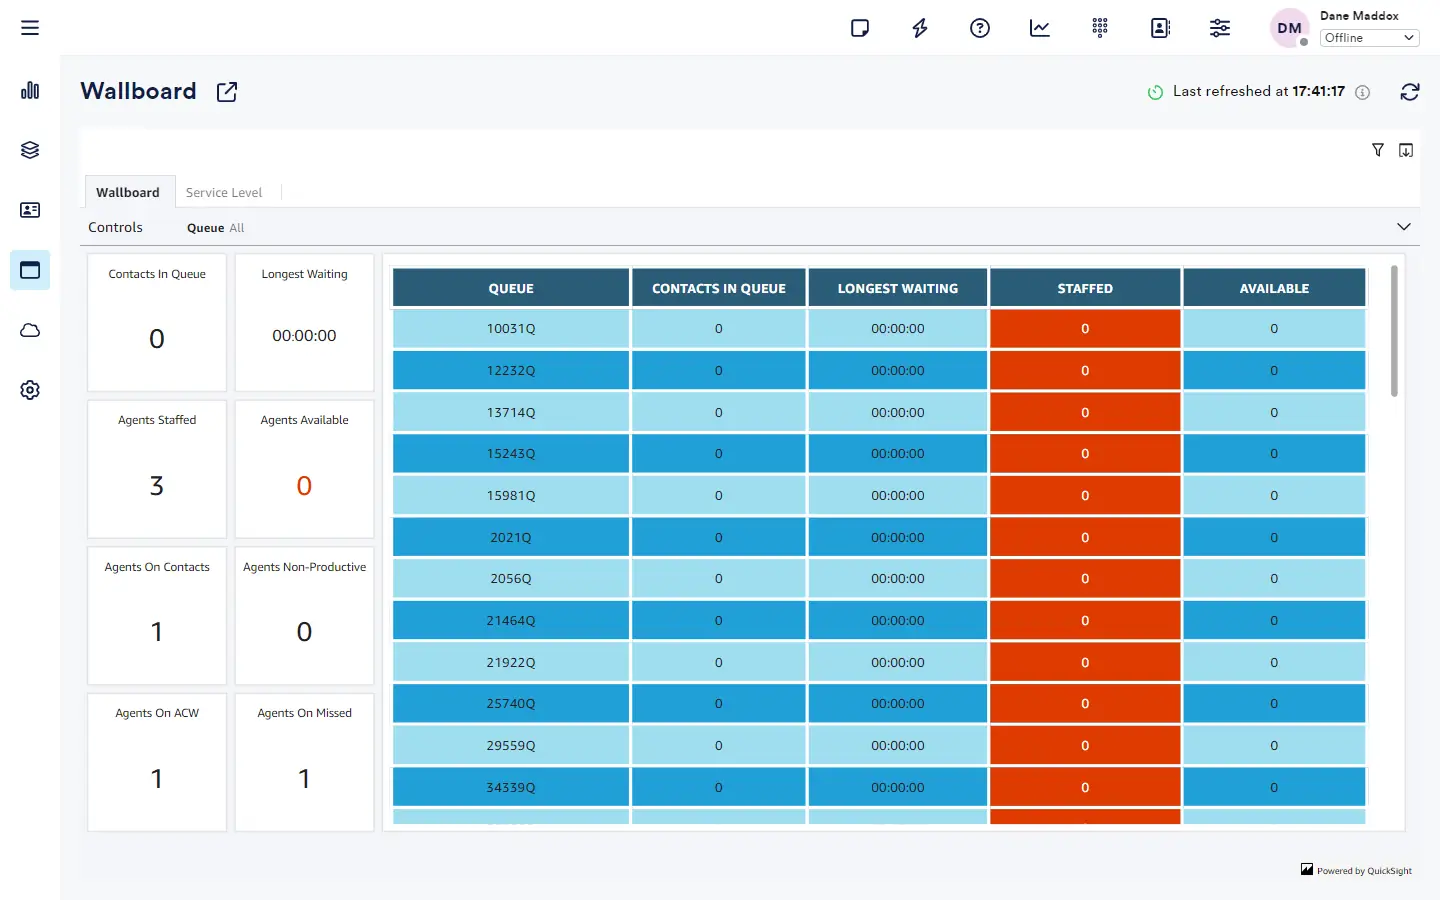
'Wallboard' Tab
The 'Wallboard' tab is the main tab that appears in the Wallboard report.
Filter Section
The following filters can be applied to this report:
| Filter | Description |
|---|---|
| Queue | Name of the Queue(s) to filter across the whole report |
Summary Section
The following is a list of each field in this section and description of that field.
| Field | Description |
|---|---|
| Contacts in Queue | Number of Contacts waiting in the queue |
| Longest Waiting | The longest time that a contact spent waiting in the queue |
| Agents Staffed | Number of Agents who are online in the softphone, and not in NPT (a custom status) |
| Agents Available | Number of agents who can take an inbound contact. An agent can only take inbound contacts when they manually set their status to Available in the Softphone |
| Agents On Contacts | Number of Agents who are in currently on call with a contact |
| Agents Non-Productive | Number of Agents who are in a custom Status. |
| Agents on ACW | Number of Agents who are in the After Call work |
| Agents on Missed | Number of Agents who has missed a contact. |
Queue Detail Table
| Field | Description |
|---|---|
| Queue | Name of the Queue |
| Contacts In Queue | Count of contacts currently waiting in that queue. |
| Longest Waiting | Longest waiting time of a contact in that particular queue. |
| Staffed | Number of Agents who are online in the softphone and not in NPT in that queue |
| Available | Number of Agents who are in Available status ready to receive a call from the contact in that queue. |
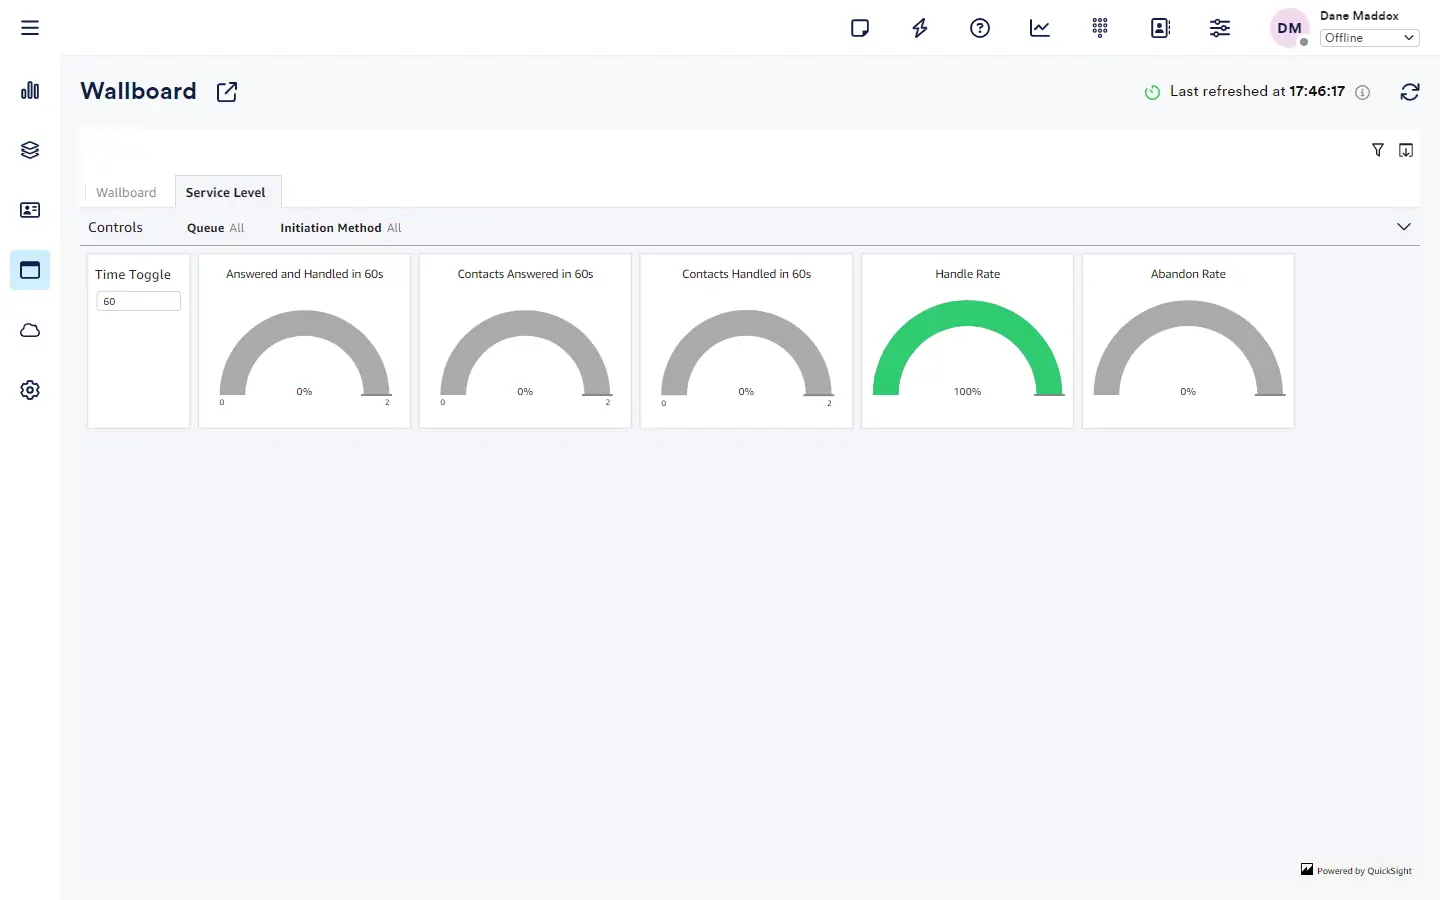
'Service Level' Tab
This report provides service level metrics for today i.e. since 12:00 AM to the point in time.
You can use Time Toggle to specify any number of seconds to customize the service level threshold.
Filter Section
| Filter | Description |
|---|---|
| Queue | Name of the Queue(s) to filter across the whole report |
| Initiation Method | Filter to select the type of method that initiated the interaction (i.e. Inbound,Outbound,Transfer,API etc) |
SLA Gauges
| Graphic/Field | Description |
|---|---|
| Time Toggle | This field can be used to modify the service level expected from the report |
| Answered and Handled in XXs | Number of Contacts answered and handled in the first XXs as per the configuration in the Time Toggle. It can be the sum of Contacts Answered and Contacts Handled. |
| Contacts Answered in XXs | Number of Contacts answered in first XXs as per the configuration in the Time Toggle. |
| Contacts Handled in XXs | Number of Contacts handled in first XXs as per the configuration in the Time Toggle. |
| Handle Rate | Number of Contacts successfully Handled within a specific XXs |
| Abandon Rate | Number of Contacts abandoned (Customer disconnected while waiting in the queue) within a specific XXs |
Performance Today
This category of dashboards provide metrics for today i.e. from 12:00 AM to the point in time.
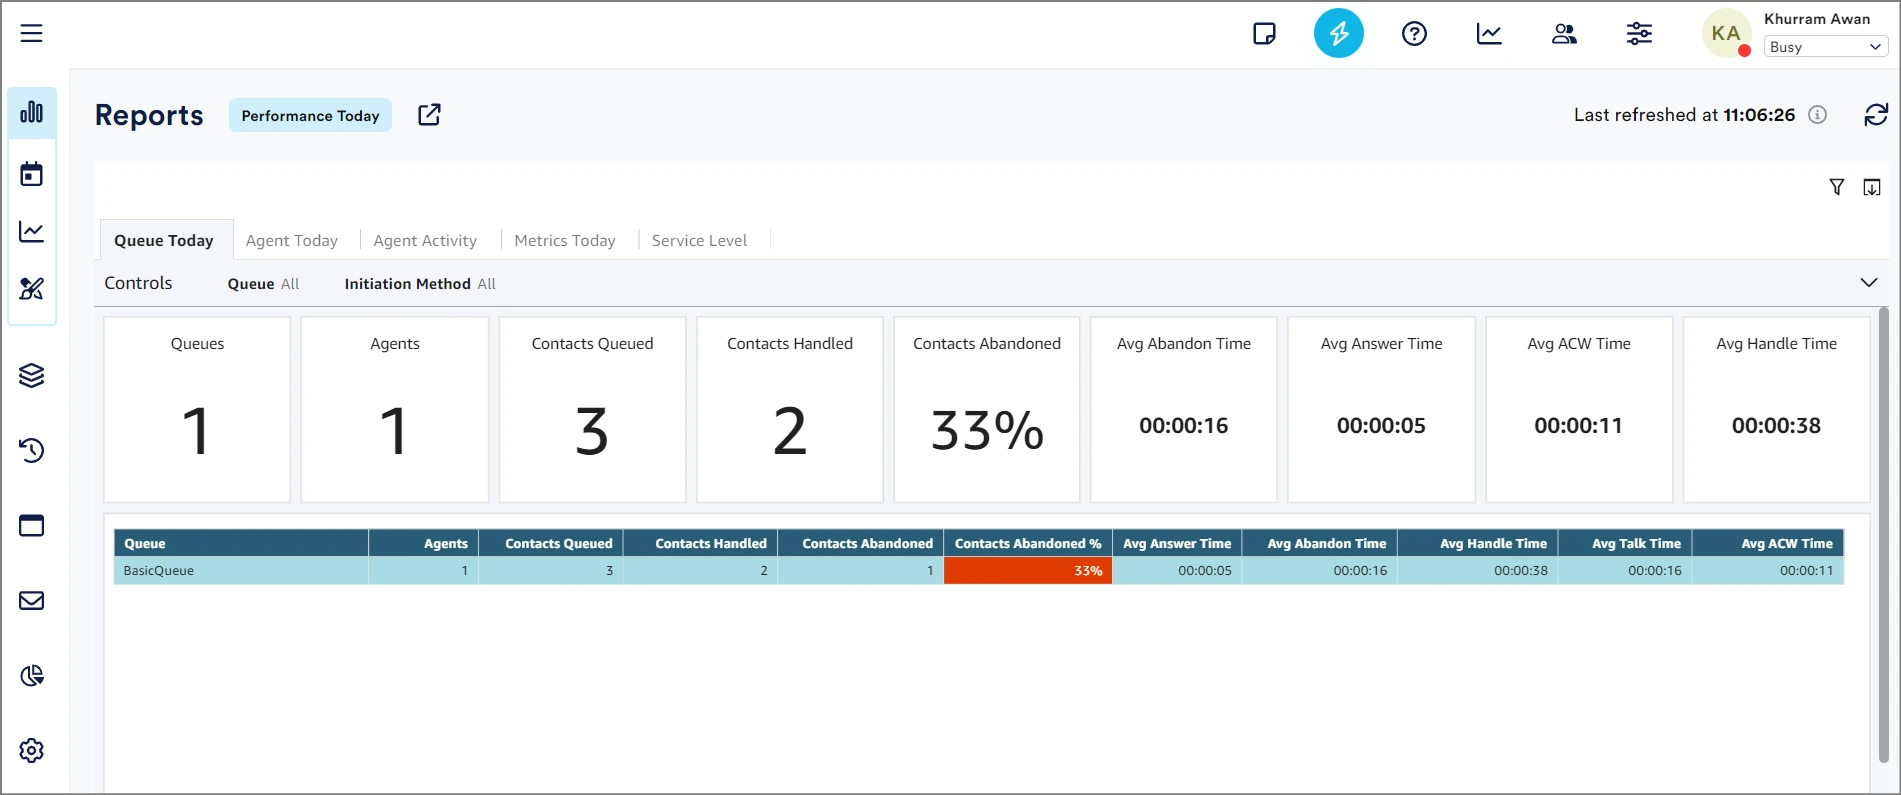
Queue Today Tab
The Queue Today dashboard provides the user with an up to date read out of the KPIs of the call center’s agents and queues.
Filters
| Field | Description |
|---|---|
| Queue | Waiting area where incoming customer interactions (like calls, chats, or emails) are held until they can be routed to available agents or resources for handling |
| Initiation Method | Filter to select the type of method that initiated the interaction (i.e. Inbound,Outbound,Transfer,API etc) |
Queue Today Summary
| Field | Description |
|---|---|
| Queues | Number of Queues participated today in the contact centre |
| Agents | Number of Agents who participated in handling the interactions for the selected queues |
| Contacts Queued | Count of contacts placed in the queue. |
| Contacts Handled | Count of contacts that were connected to an agent. |
| Contacts Abandoned | Count of contacts that was removed from the selected queue but not answered by an agent or queued for callback. |
| Avg Abandon Time | Average time that contacts waited in the queue before being abandoned. This is calculated by averaging the difference between EnqueueTimestamp and DequeueTimestamp (from the contact record) for abandoned contacts. |
| Avg Answer Time | Average time that contacts waited in the queue before being answered by an agent. In some businesses, this is also known as average speed of answer (ASA). |
| Avg ACW Time | Average amount of time that an agent spent doing After Contact Work (ACW) for the selected Queues. |
Queue Detail Table
| Field | Description |
|---|---|
| Contacts Abandoned % | The percentage of contacts disconnected by the customer while in the queue over total contacts. |
| Avg Answer | Average time that contacts waited in the queue before being answered by an agent. In some businesses, this is also known as average speed of answer (ASA). |
| Avg Abandon Time | Average time that contacts waited in the queue before being abandoned. This is calculated by averaging the difference between EnqueueTimestamp and DequeueTimestamp (from the contact record) for abandoned contacts. |
| Avg Handle Time | The average time, from start to finish, that a contact was connected with an agent (average handled time). It includes talk time, hold time, and After Contact Work (ACW) time. |
| Avg Talk Time | The average time, from start to finish, that a contact was talking to the Agent |
| Avg ACW Time | Average amount of time that an agent spent doing After Contact Work (ACW) for the selected Queues. |
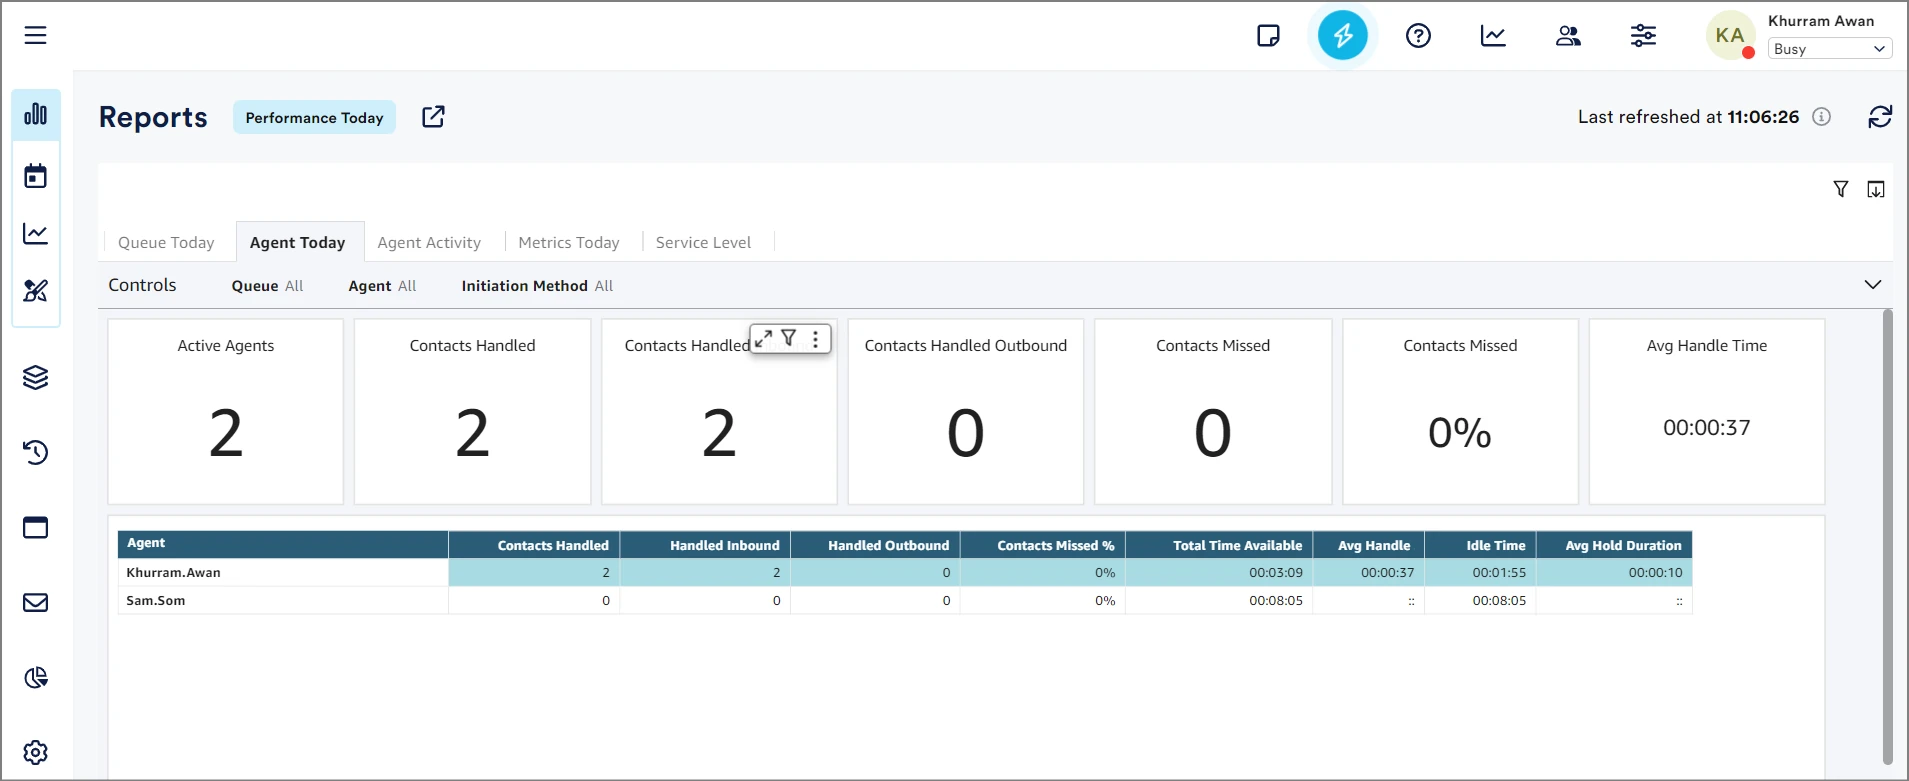
Agent Today Tab
The Agent Today dashboard provides the user up to date KPIs of their call center agents. Using the Controls panel, the user can filter and compare different agents’ performance.
Filters
| Filter | Description |
|---|---|
| Queue | Waiting area where incoming customer interactions (like calls, chats, or emails) are held until they can be routed to available agents or resources for handling |
| Agent | Agent who has participated in the Interactions |
| Initiation Method | Filter to select the type of method that initiated the interaction (i.e. Inbound,Outbound,Transfer,API etc) |
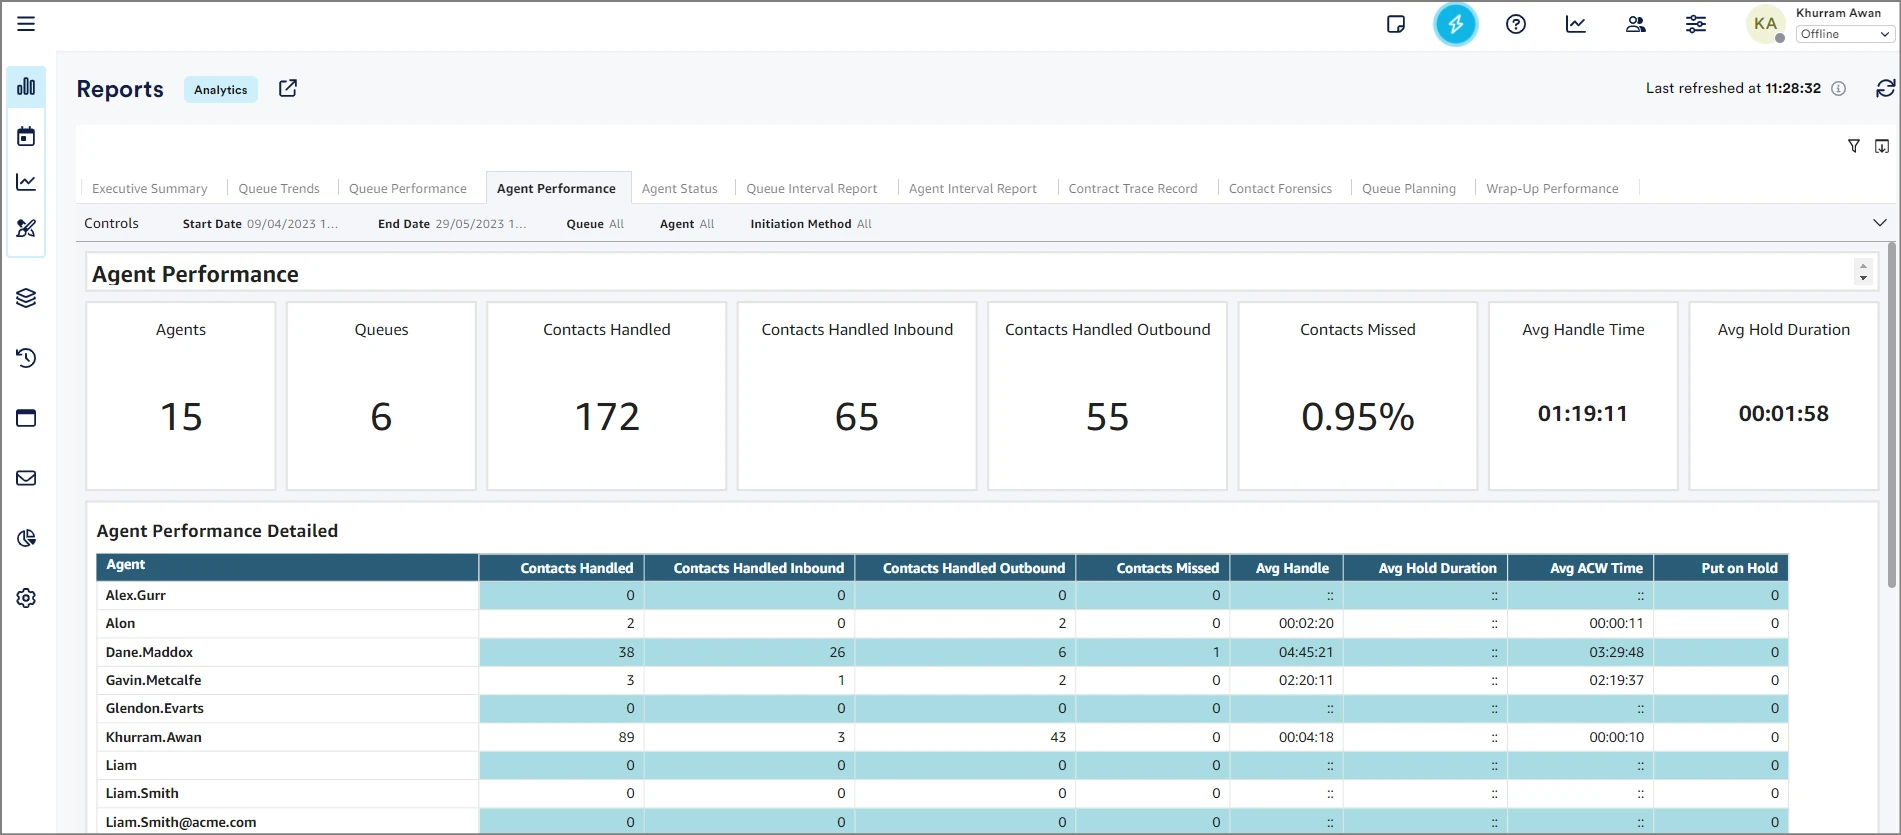
Agent Today Summary
| Field | Description |
|---|---|
| Active Agents | Number of Queues participated today in the contact centre |
| Contacts Handled | Count of contacts that were connected to an agent. |
| Contacts Handled Inbound | Count of inbound contacts that were connected to an agent. |
| Contacts Handled Outbound | Count of outbound contacts that were connected to an agent. |
| Contacts Missed | Count of contacts routed to an agent but not answered by the agent, including contacts abandoned by the customer. A contact can be counted as missed multiple times, once for each time it is routed to an agent but not answered. |
| Contacts Missed % | Percentage of contacts routed to an agent but not answered by the agent, including contacts abandoned by the customer. A contact can be counted as missed multiple times, once for each time it is routed to an agent but not answered. |
| Avg Handle Time | The average time, from start to finish, that a contact was connected with an agent (average handled time). It includes talk time, hold time, and After Contact Work (ACW) time. |
Agent Detail Table
| Field | Description |
|---|---|
| Agent | Number of Agent Queues participated today in the contact centre for the selected queue |
| Contacts Handled | Count of contacts that were connected to an agent. |
| Handled Inbound | Count of inbound contacts that were connected to an agent. |
| Handled Outbound | Count of outbound contacts that were connected to an agent. |
| Contacts Missed % | Percentage of contacts routed to an agent but not answered by the agent, including contacts abandoned by the customer. A contact can be counted as missed multiple times, once for each time it is routed to an agent but not answered. |
| Total Time Available | Total time that agents spent in the Available status (Routable). |
| Avg Handle | The average time, from start to finish, that a contact was connected with an agent (average handled time). It includes talk time, hold time, and After Contact Work (ACW) time. |
| Idle Time | After the agent sets their status in NEONNOW this is the amount of time they weren't handling contacts + any time their contacts were in an Error state |
| Avg Hold Duration | Average time that customers spent on hold while connected to an agent. |
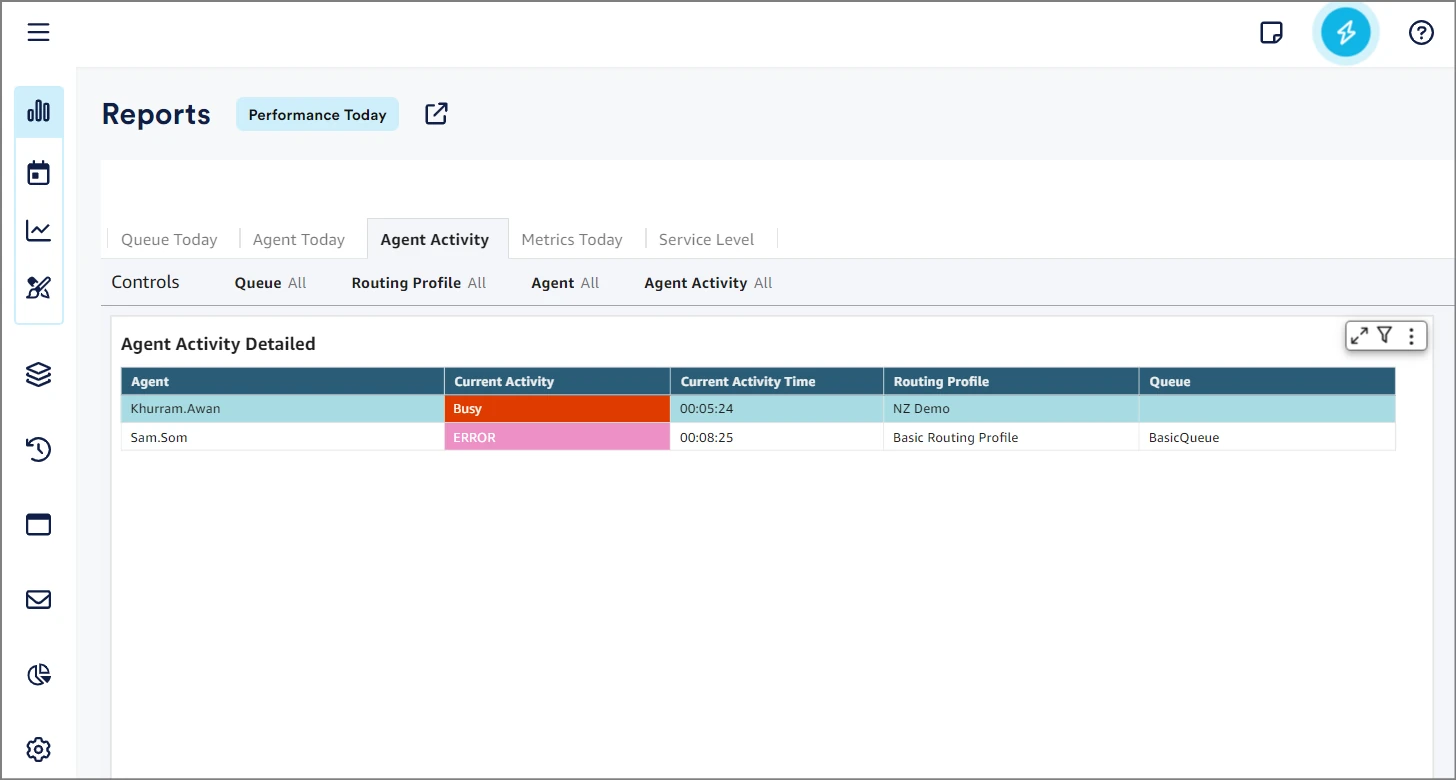
Agent Activity Tab
The Agent Activity dashboard is a tablet that gives the user up-to-date information on one or a group of agents’ activity and status.
Filters
| Filter | Description |
|---|---|
| Queue | Waiting area where incoming customer interactions (like calls, chats, or emails) are held until they can be routed to available agents or resources for handling |
| Routing Profile | Agents Skillset who has participated in the interaction. |
| Agent | Agents who has participated in the Interactions |
| Agent Activity | All the Status of the Agents including NEONNOW Status (Custom) |
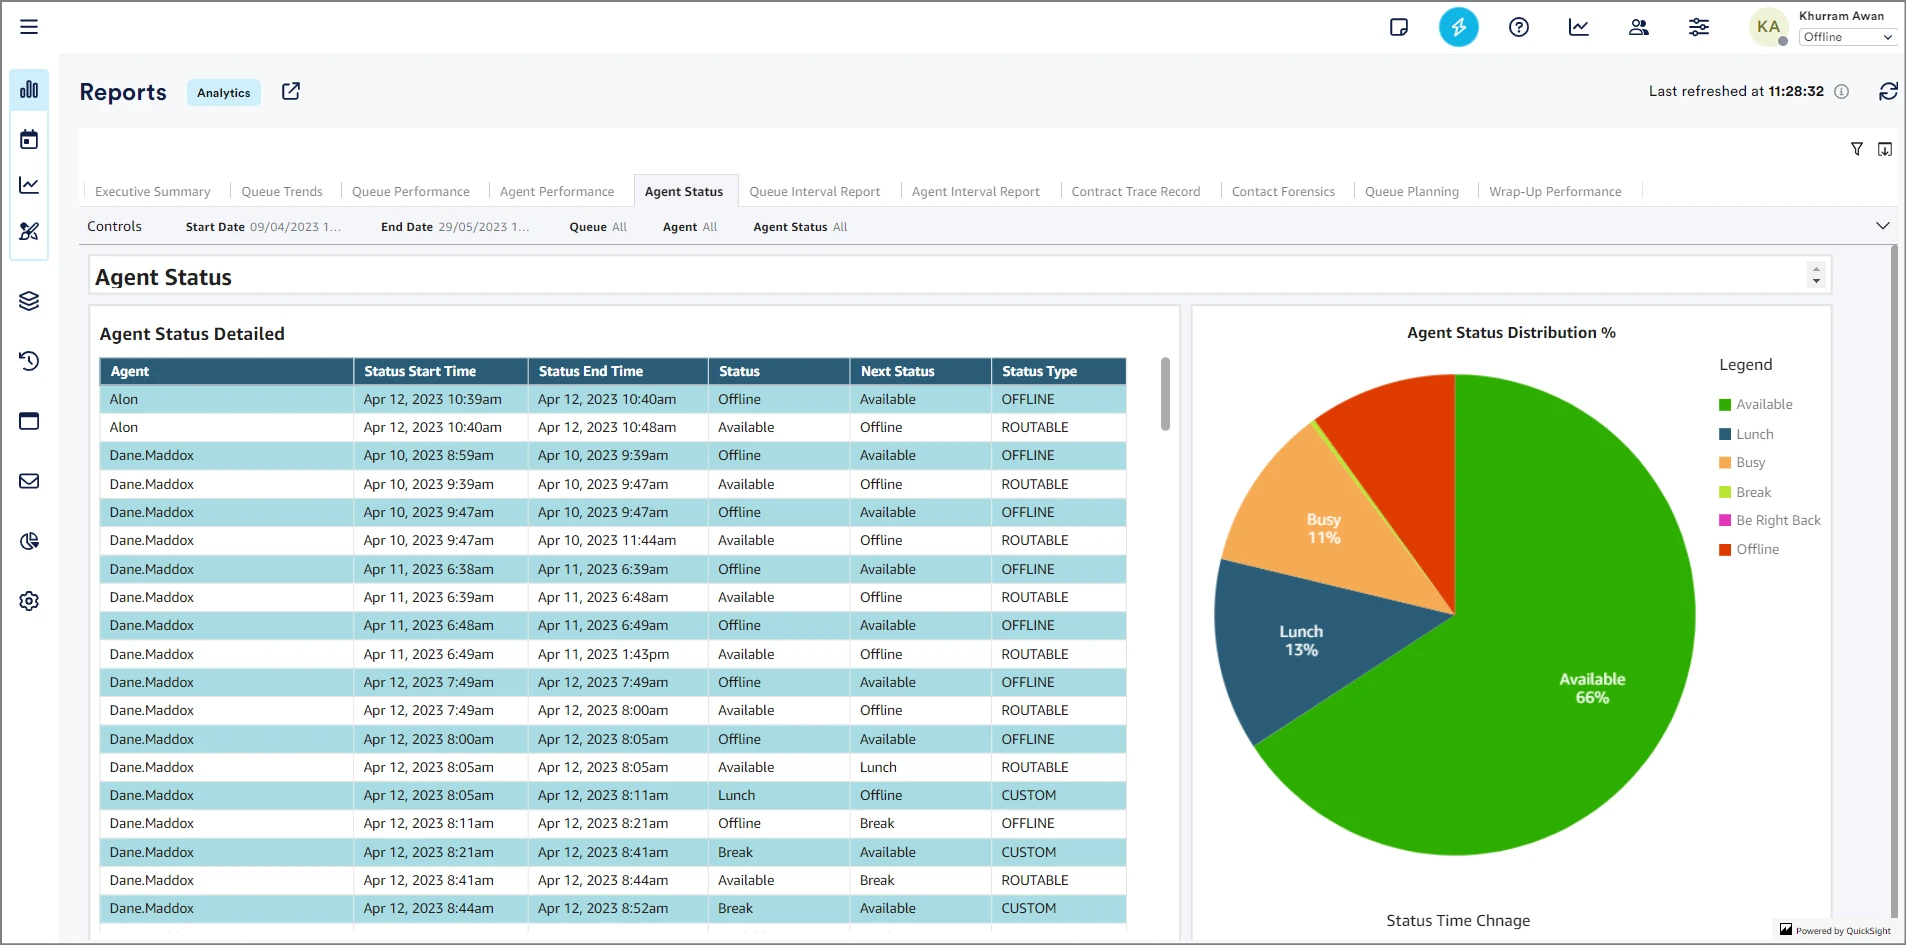
Agent Activity Detail Table
| Field | Description |
|---|---|
| Agent | Number of Agent Queues participated today in the contact centre for the selected queue |
| Current Activity | This is the current status of the agent for the selected filter |
| Current Activity Time | Time in HH:MM:SS for the current status of the Agent |
| Routing Profile | Routing Profile (Skillset) of the agent involved. |
| Queue | Queue that was served by the agent during the interaction with the contact. |
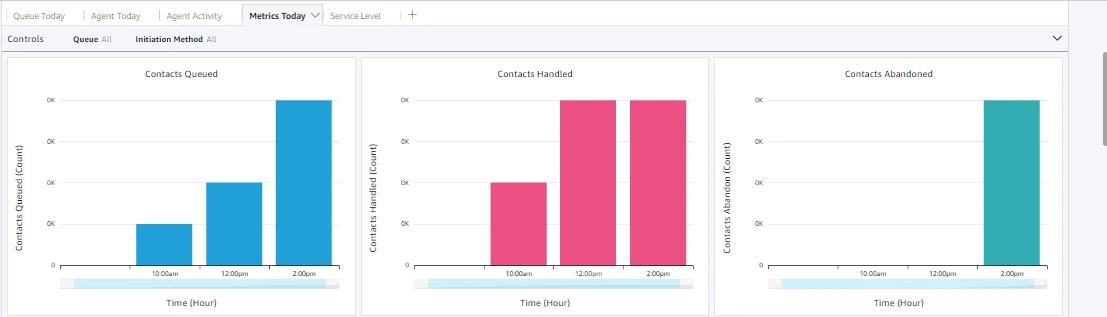
Metrics Today Tab
The Metrics Today dashboard provides quick view breakdowns of individual metrics hour by hour in the course of a day. The following shows some of the sample metrics from this report tab:
Filters
| Filter | Description |
|---|---|
| Queue | Waiting area where incoming customer interactions (like calls, chats, or emails) are held until they can be routed to available agents or resources for handling |
| Initiation Method | Filter to select the type of method that initiated the interaction (i.e. Inbound,Outbound,Transfer,API etc) |
**Metrics Detail **
| Graph | Description |
|---|---|
| Contacts Queued | "Contact Queued vs Time in Hour" is a visual representation that illustrates how the number of customer contacts waiting in the queue varies over the course of the day. |
| Contacts Queued | "Contacts Handled vs Time in Hour" is a visual tool that displays how many customer contacts have been successfully addressed or resolved during different hours of the day. |
| Contacts Abandoned | "Contacts Abandoned vs Time in Hour" is a visual representation that illustrates the number of customer contacts that have been abandoned or not serviced during various hours of the day. |
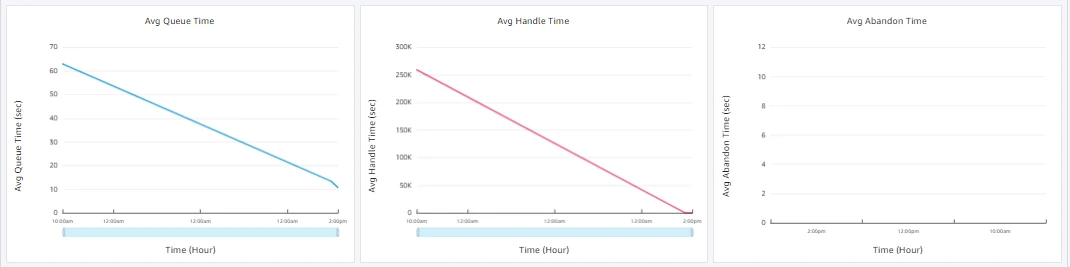
| Avg. Queue Time | "Average Queue Time vs Time in Hour" provides a visual overview of how the average time customers spend waiting in a queue before their inquiries are addressed or resolved during different hours of the day |
| Avg. Handle Time | "Average Handle Time vs Time in Hour" offers a visual representation of how the average time it takes for customer contacts to be handled and resolved changes during various hours of the day. |
| Avg. Abandon Time | "Average Abandon Time vs Time in Hour" is a visual representation that illustrates the average amount of time customers wait in the queue before abandoning their calls or inquiries during different hours of the day. |
| Avg Interaction Time | “Average Interaction Time vs Time in Hour" offers a visual representation of how the average duration of customer interactions with the contact center changes during different hours of the day |
| Avg Hold Time | "Average Hold Time vs Time in Hour" provides a visual representation of how the average amount of time customers are placed on hold during their interactions with the contact center fluctuates throughout various hours of the day. |
| Contacts Handled Inbound | "Contacts Handled Inbound vs Time in Hour" is a visual representation that shows the number of incoming customer contacts (such as calls, emails, chats, etc.) successfully managed or resolved by agents during different hours of the day. |
| Contacts Handled Outbound | "Contacts Handled Outbound vs Time in Hour" provides a visual representation of the number of outbound customer contacts initiated and successfully managed by agents during different hours of the day |
| Contacts Handled Callback | "Contacts Handled Callback vs Time in Hour" illustrates the number of customer callbacks that have been successfully addressed or resolved by agents during different hours of the day. |
| Missed Contacts | "Missed Contacts vs Time in Hour" is a visual representation that displays the number of customer contacts that were not answered or handled by agents during various hours of the day. |
| Contacts On Hold Abandon | "Contacts On Hold Abandon vs Time in Hour" is a visual representation that illustrates the number of customer contacts that were abandoned while on hold during different hours of the day |
| Max Queue Time | "Max Queue Time vs Time in Hour" is a visual representation that displays the maximum amount of time customers have spent waiting in the queue before their inquiries are addressed or resolved during various hours of the day. |
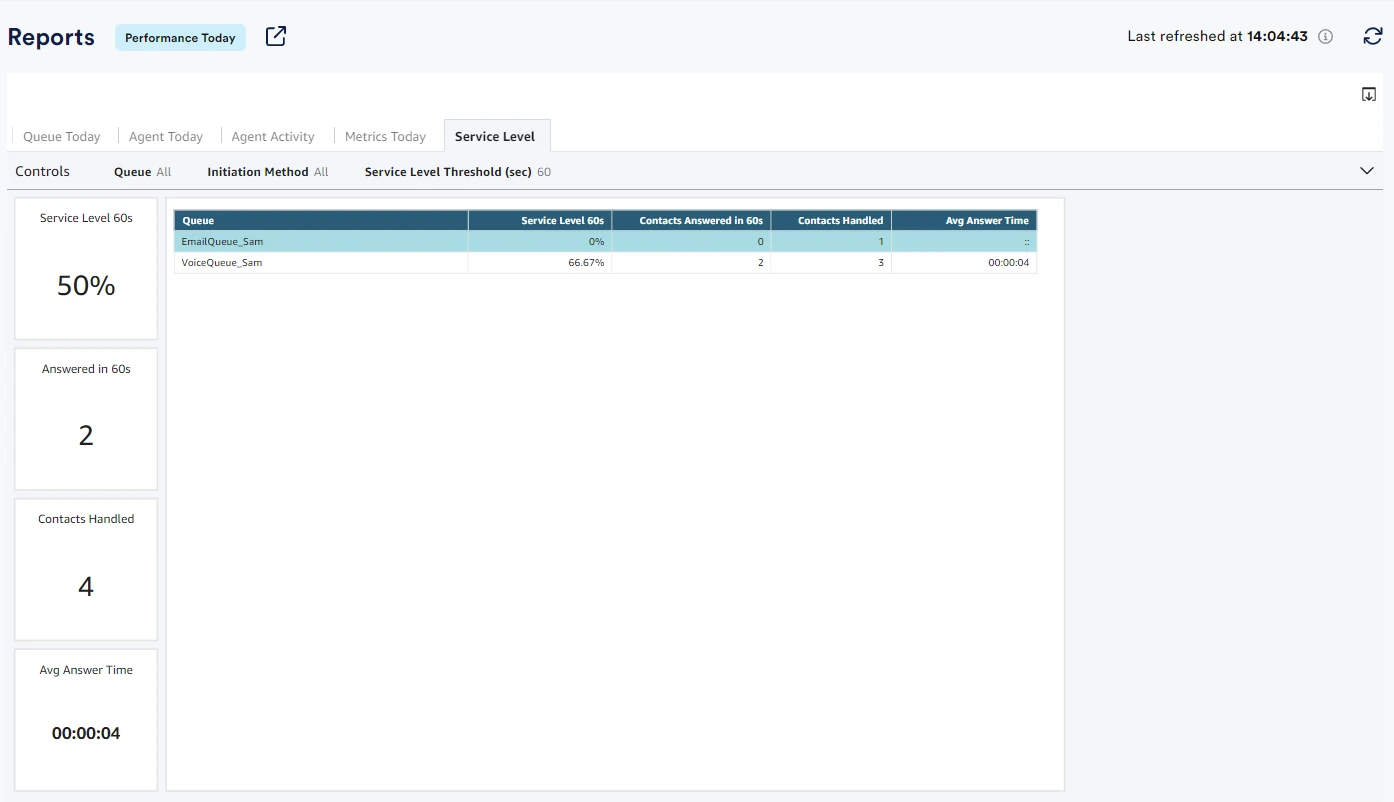
Service Level Tab
Filters
| Filter | Description |
|---|---|
| Queue | Waiting area where incoming customer interactions (like calls, chats, or emails) are held until they can be routed to available agents or resources for handling |
| Initiation Method | Filter to select the type of method that initiated the interaction (i.e. Inbound,Outbound,Transfer,API etc) |
| Service Level Threshold(sec) | Filter update the time threshold for all widgets in the report. |
**Service Level Overview **
| Graphic | Description |
|---|---|
| Service Level {x}s | Service Level across all selected filters, aggregated across queues |
| Answered in {x}s | Contacts answered within the time threshold |
| Contacts Handled | Total contacts Handled |
| Avg Answer Time | Average time to answer interactions for all selected filters |
**Service Level Table **
A table showing all queues and relevant Service Level statistics for each queue.
| Field | Description |
|---|---|
| Queue | Waiting area where incoming customer interactions (like calls, chats, or emails) are held until they can be routed to available agents or resources for handling |
| Service Level {x}s | Service Level across all selected filters, per queue |
| Contacts Answered in {x}s | Contacts answered within the time threshold |
| Contacts Handled | Total contacts Handled, per queue |
| Avg Answer Time | Average time to answer interactions for all selected filters, per Queue |
Analytics
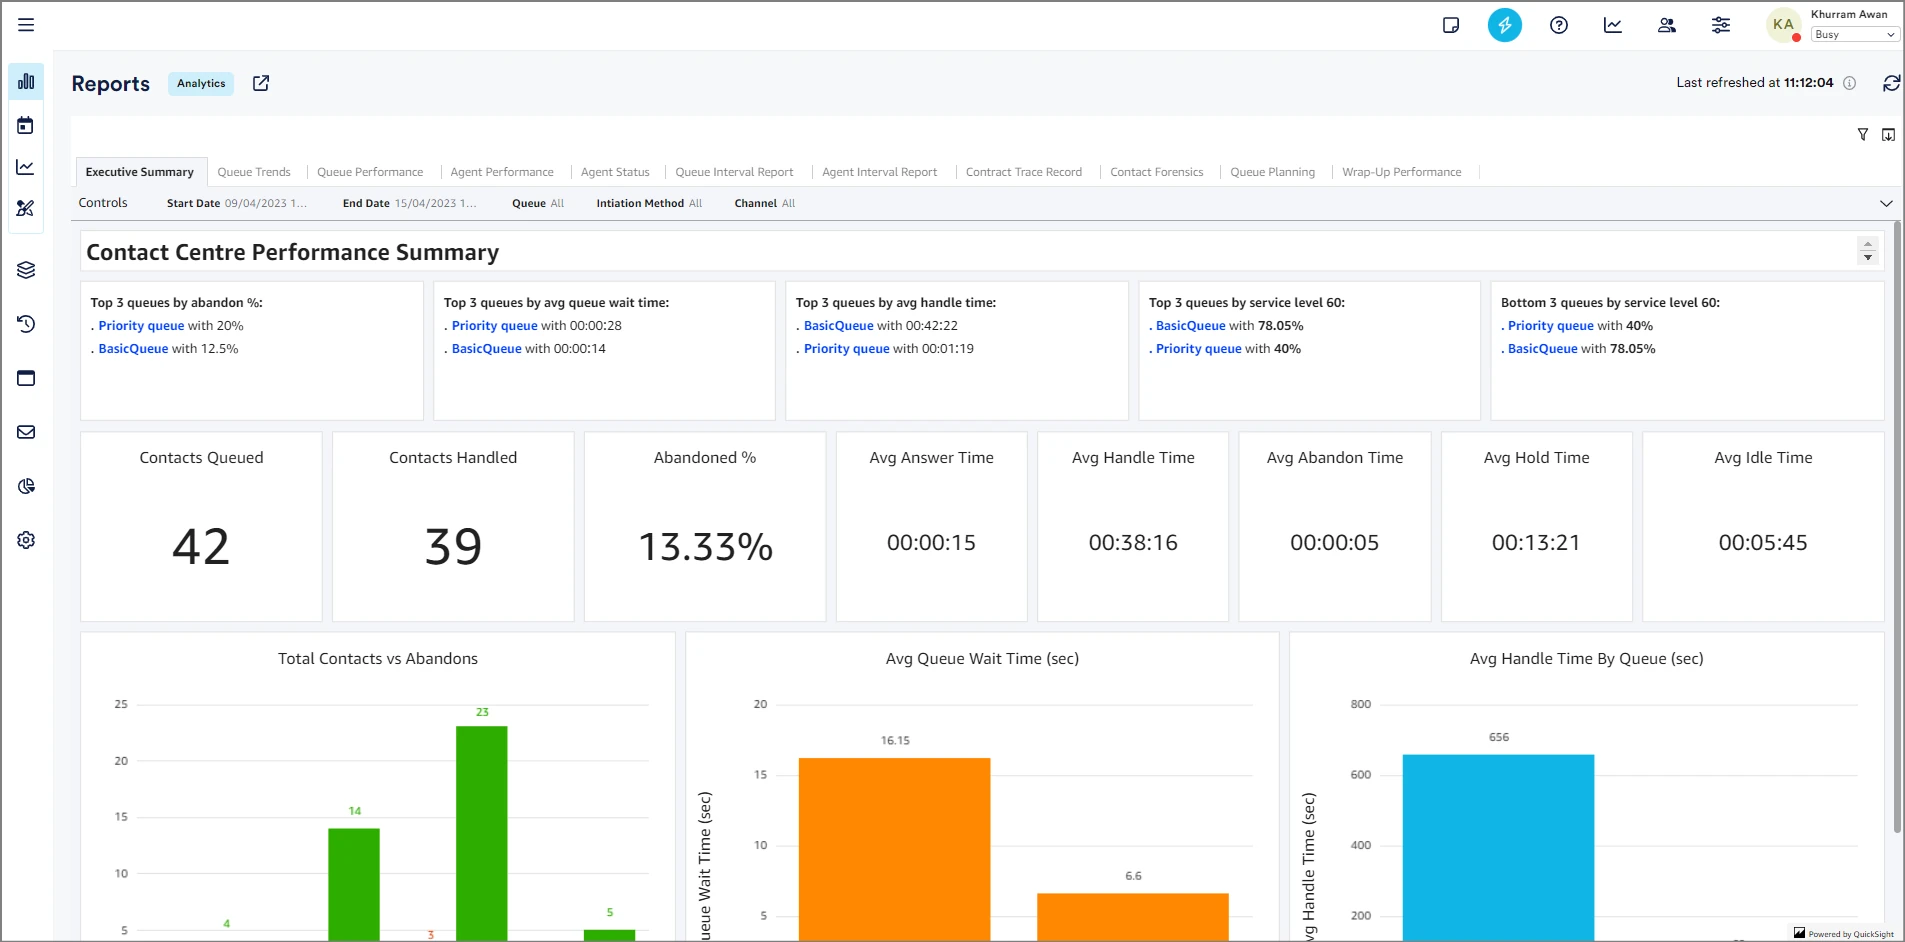
Executive Summary
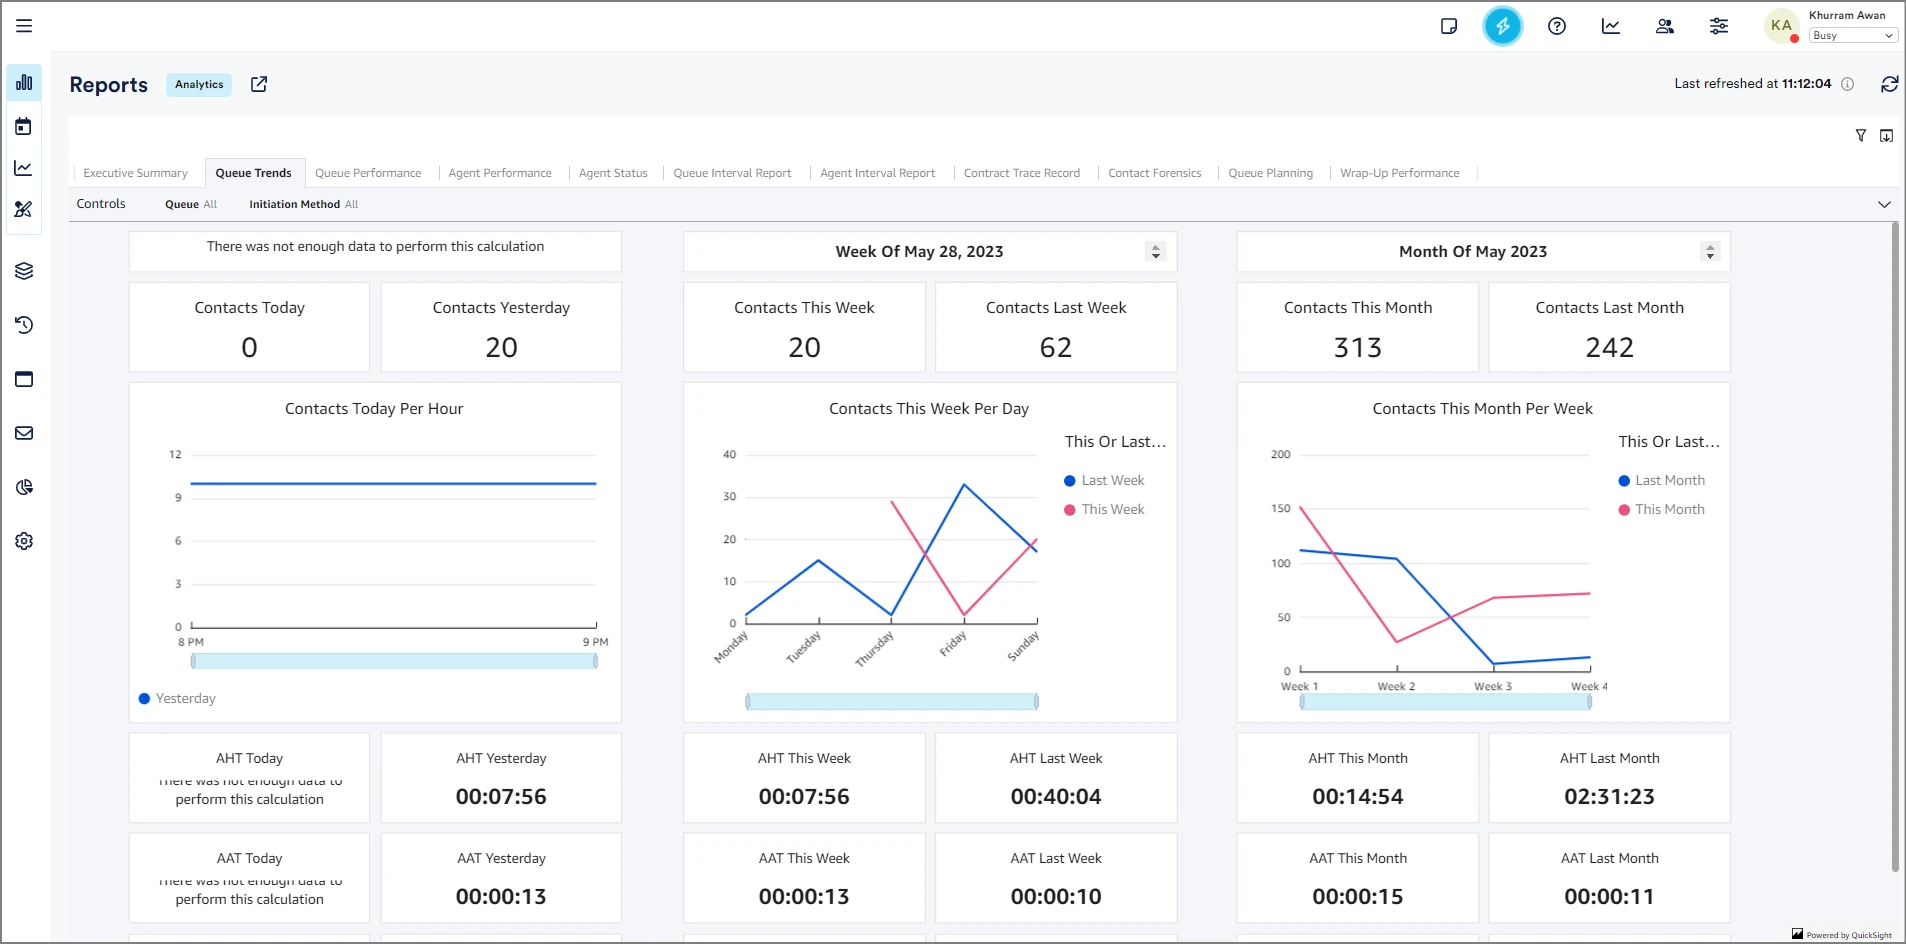
Queue Trends
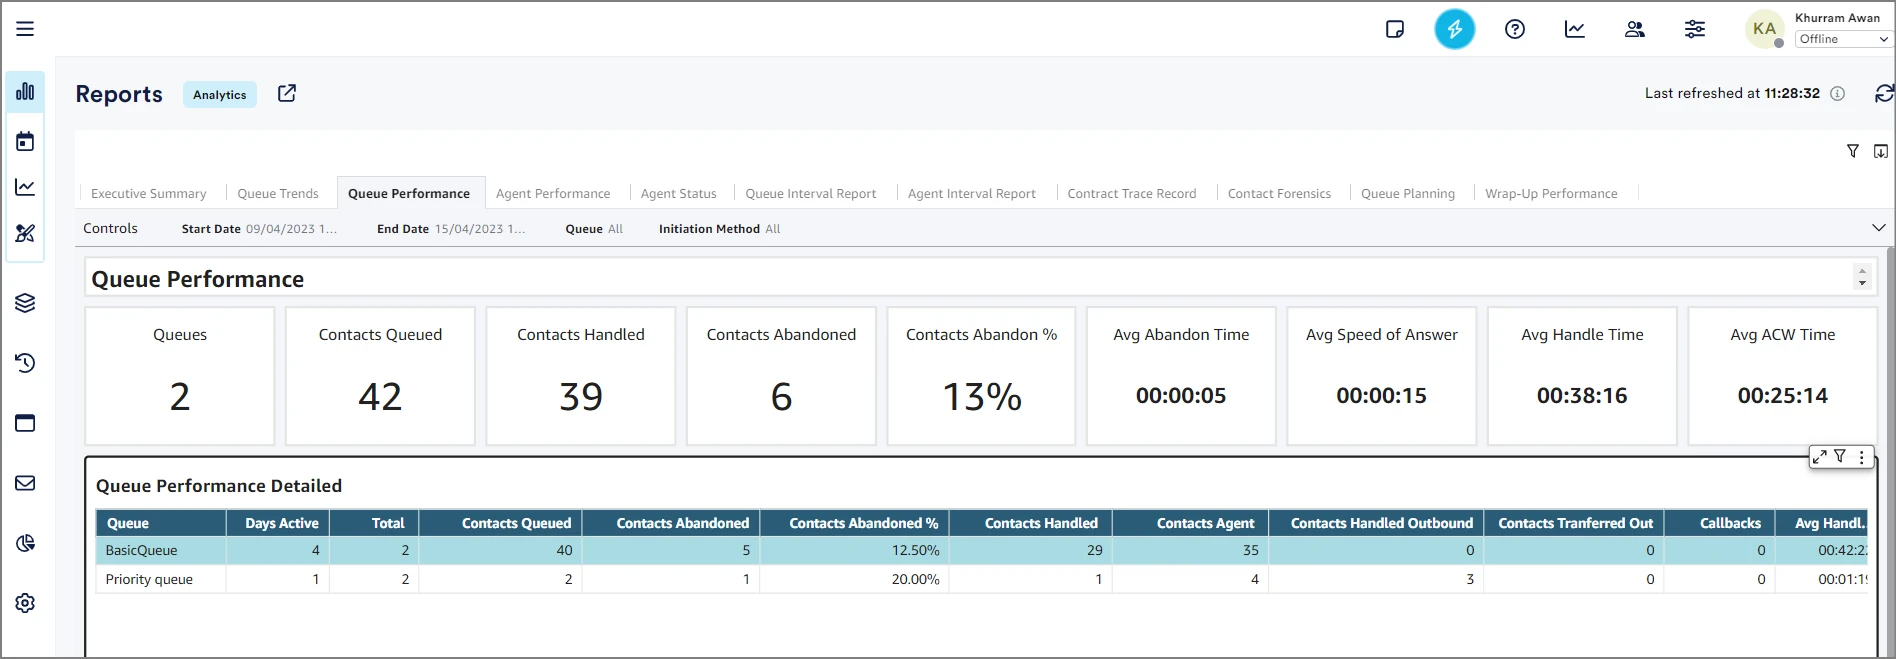
Queue Performance
Agent Performance
Agent Status
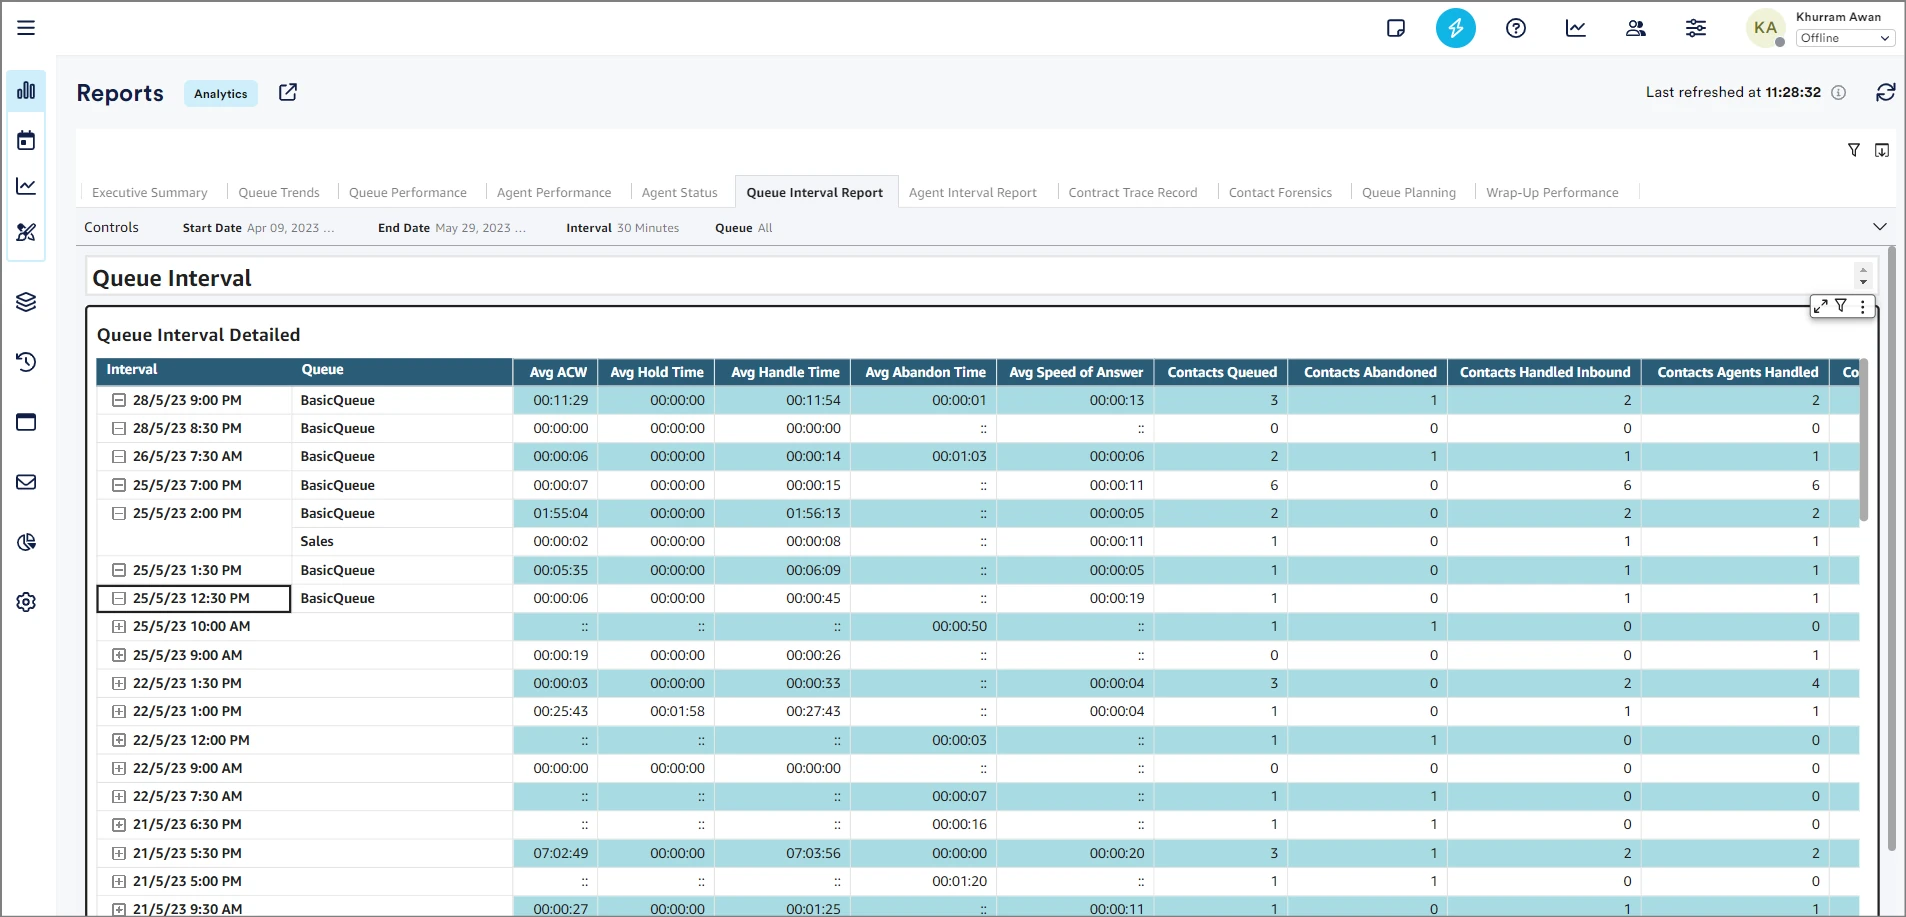
Queue Interval Report
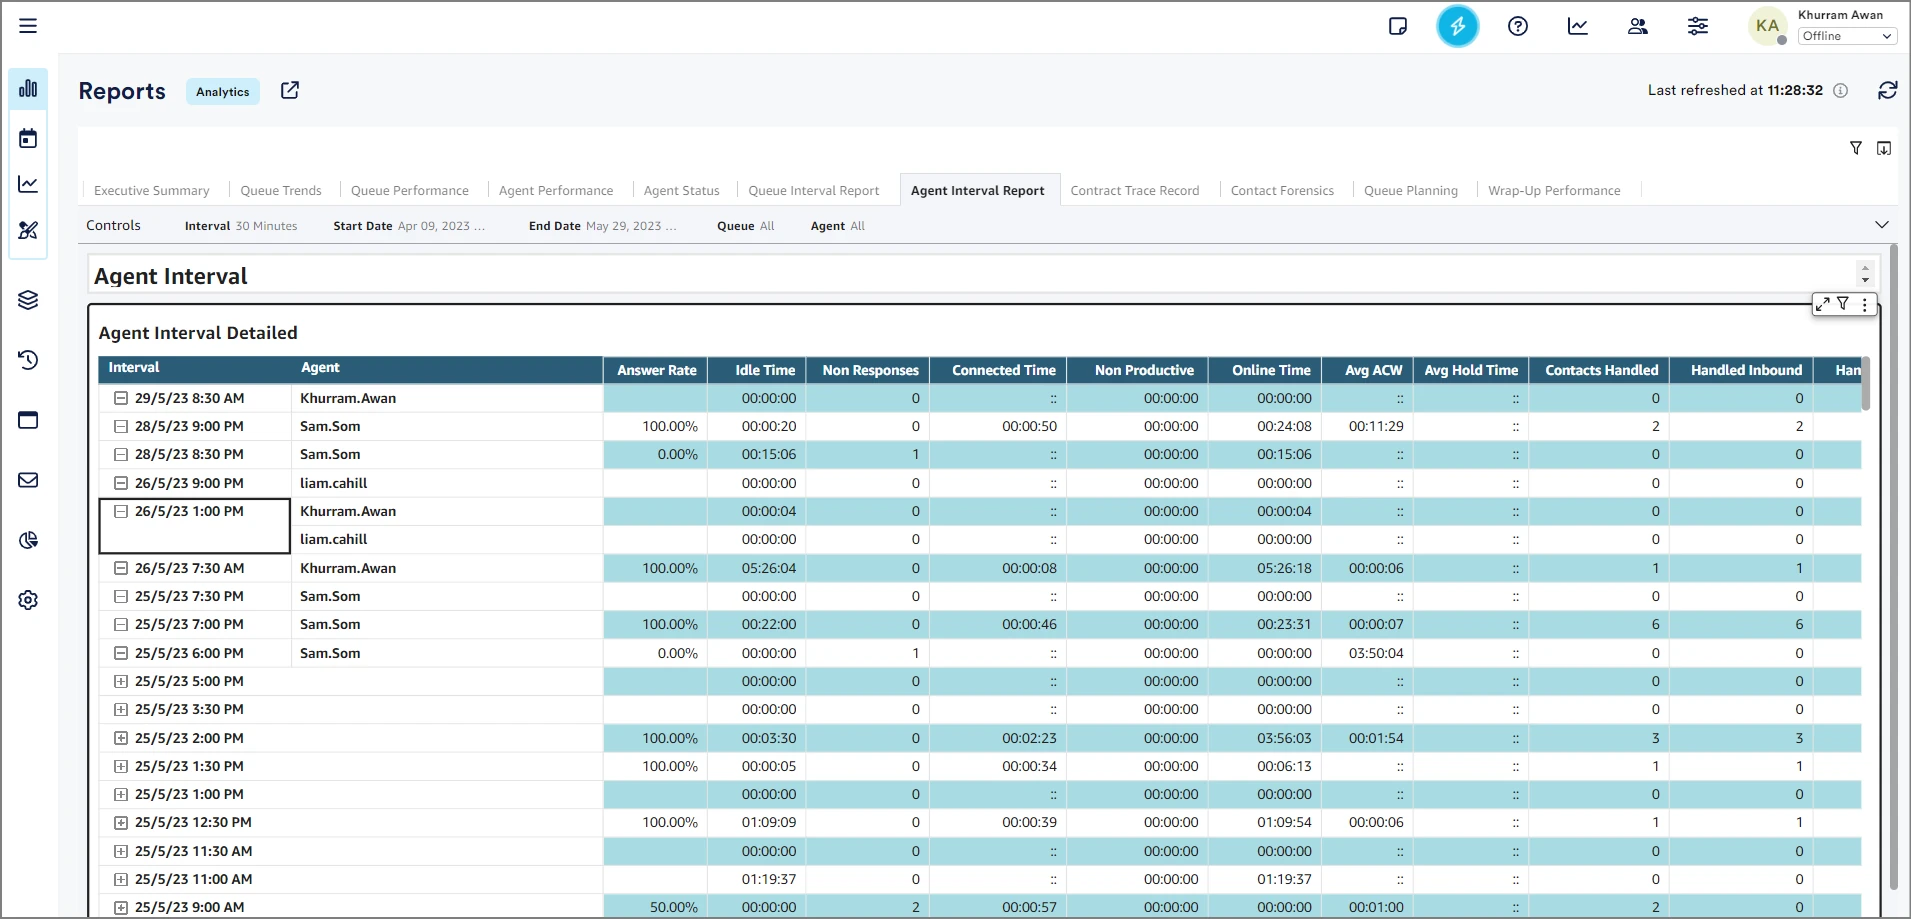
Agent Interval Report
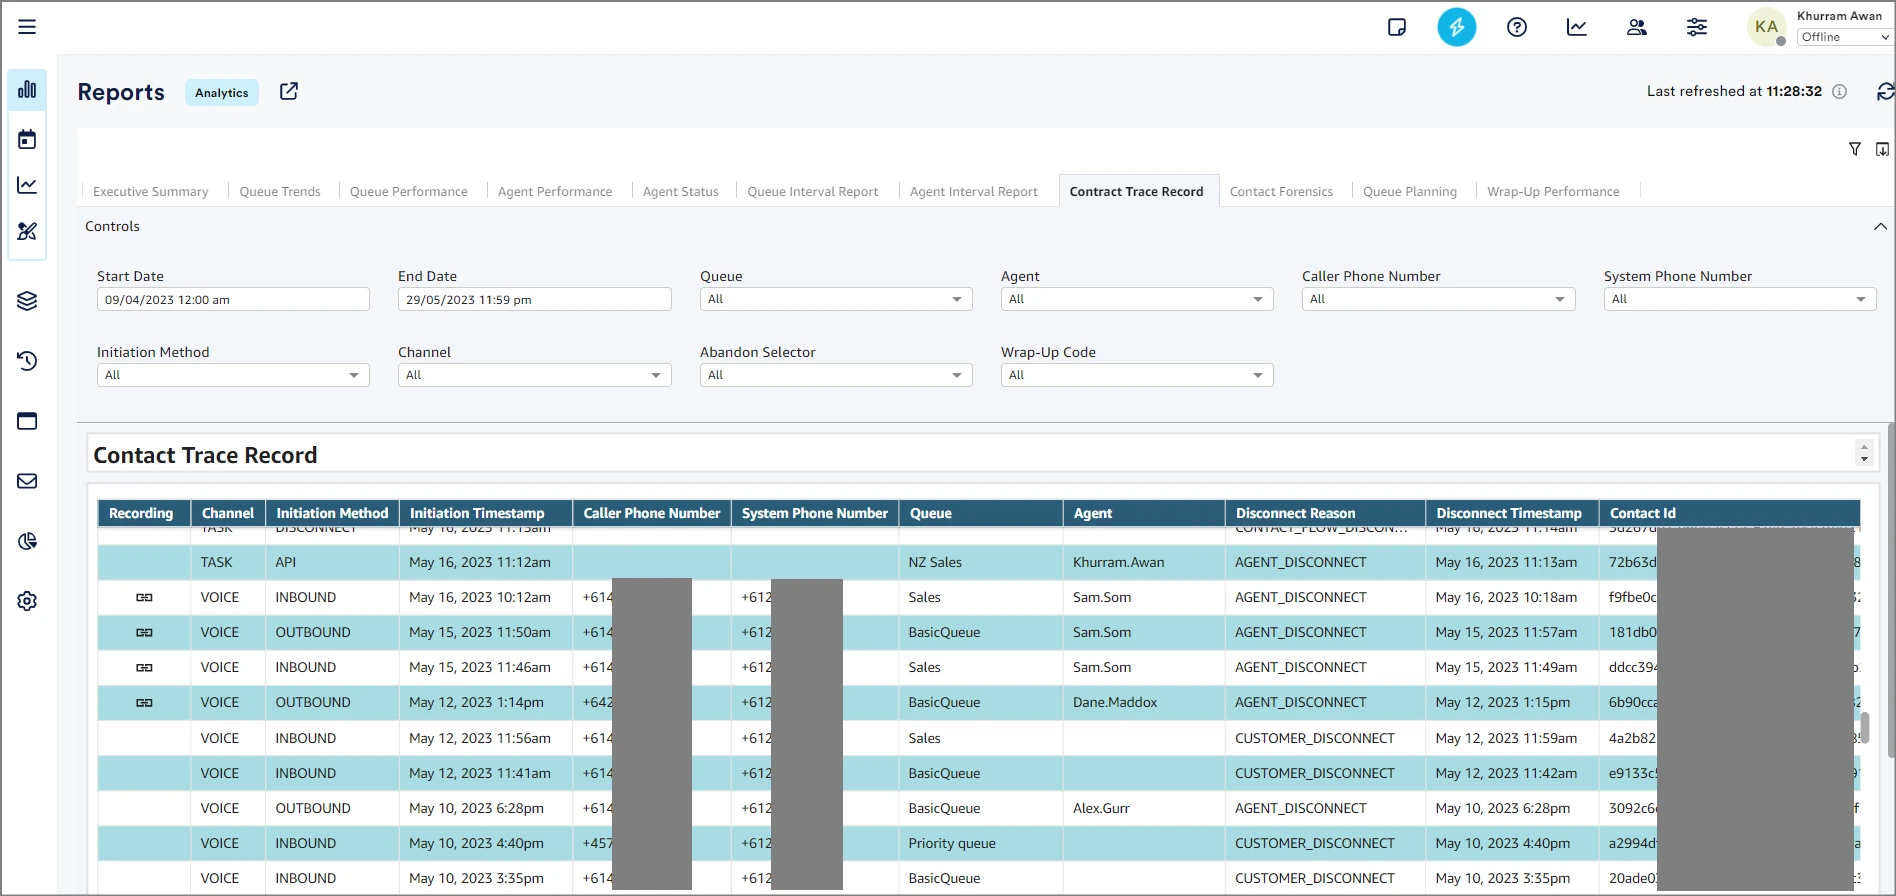
Contact Trace Records
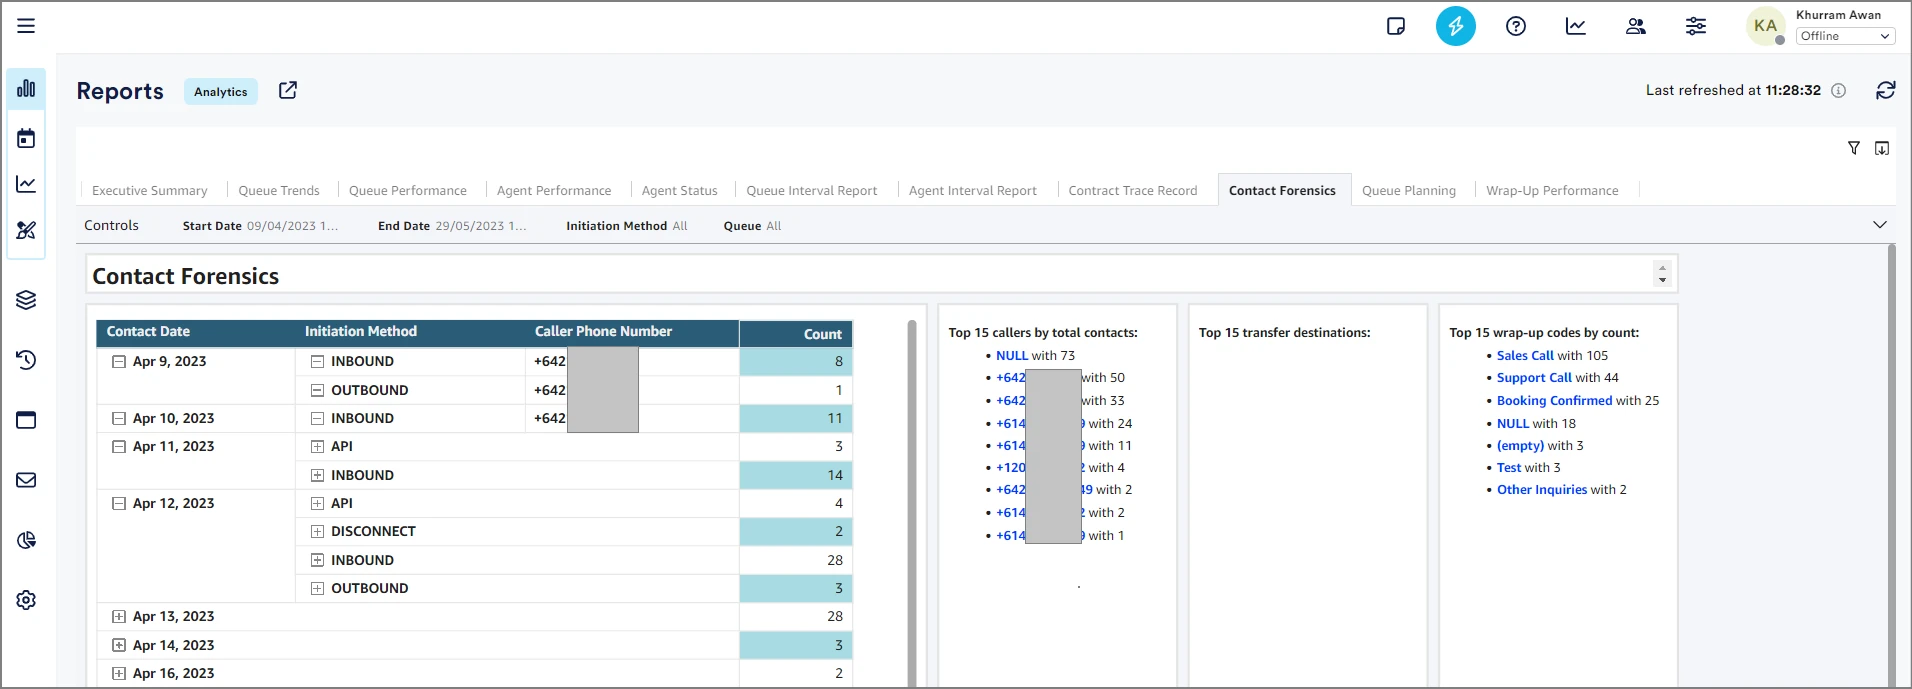
Contact Forensics
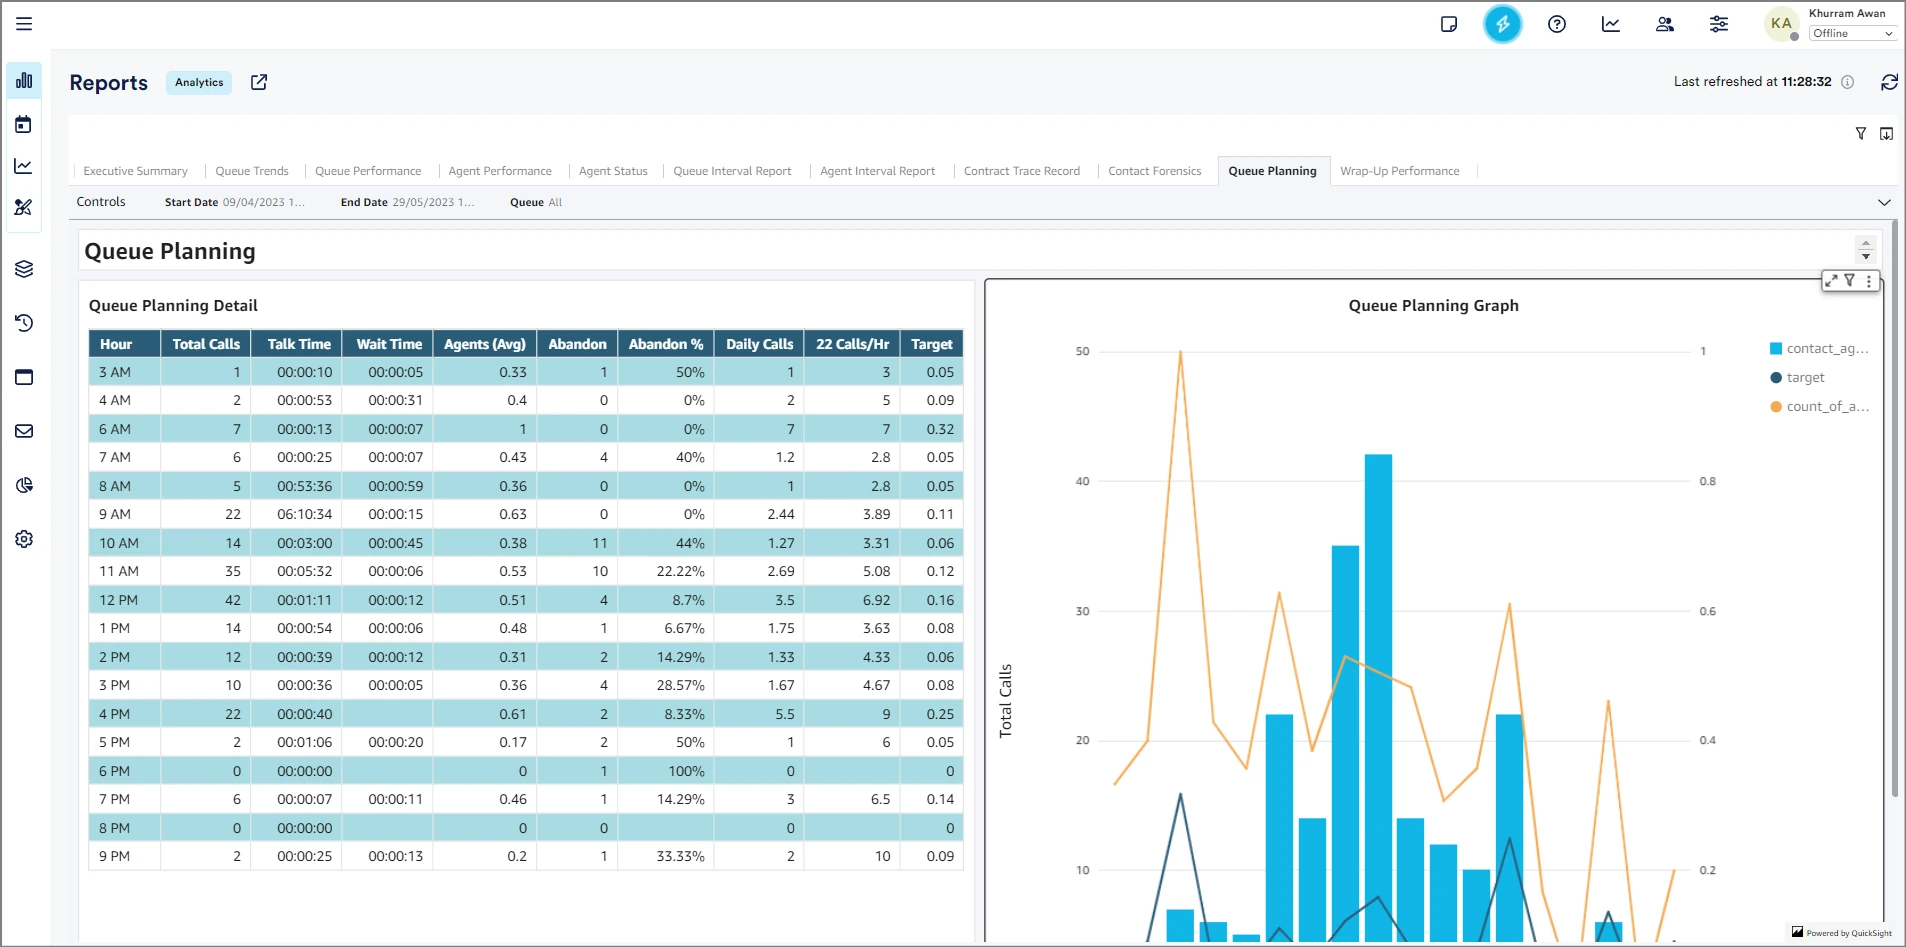
Queue Planning
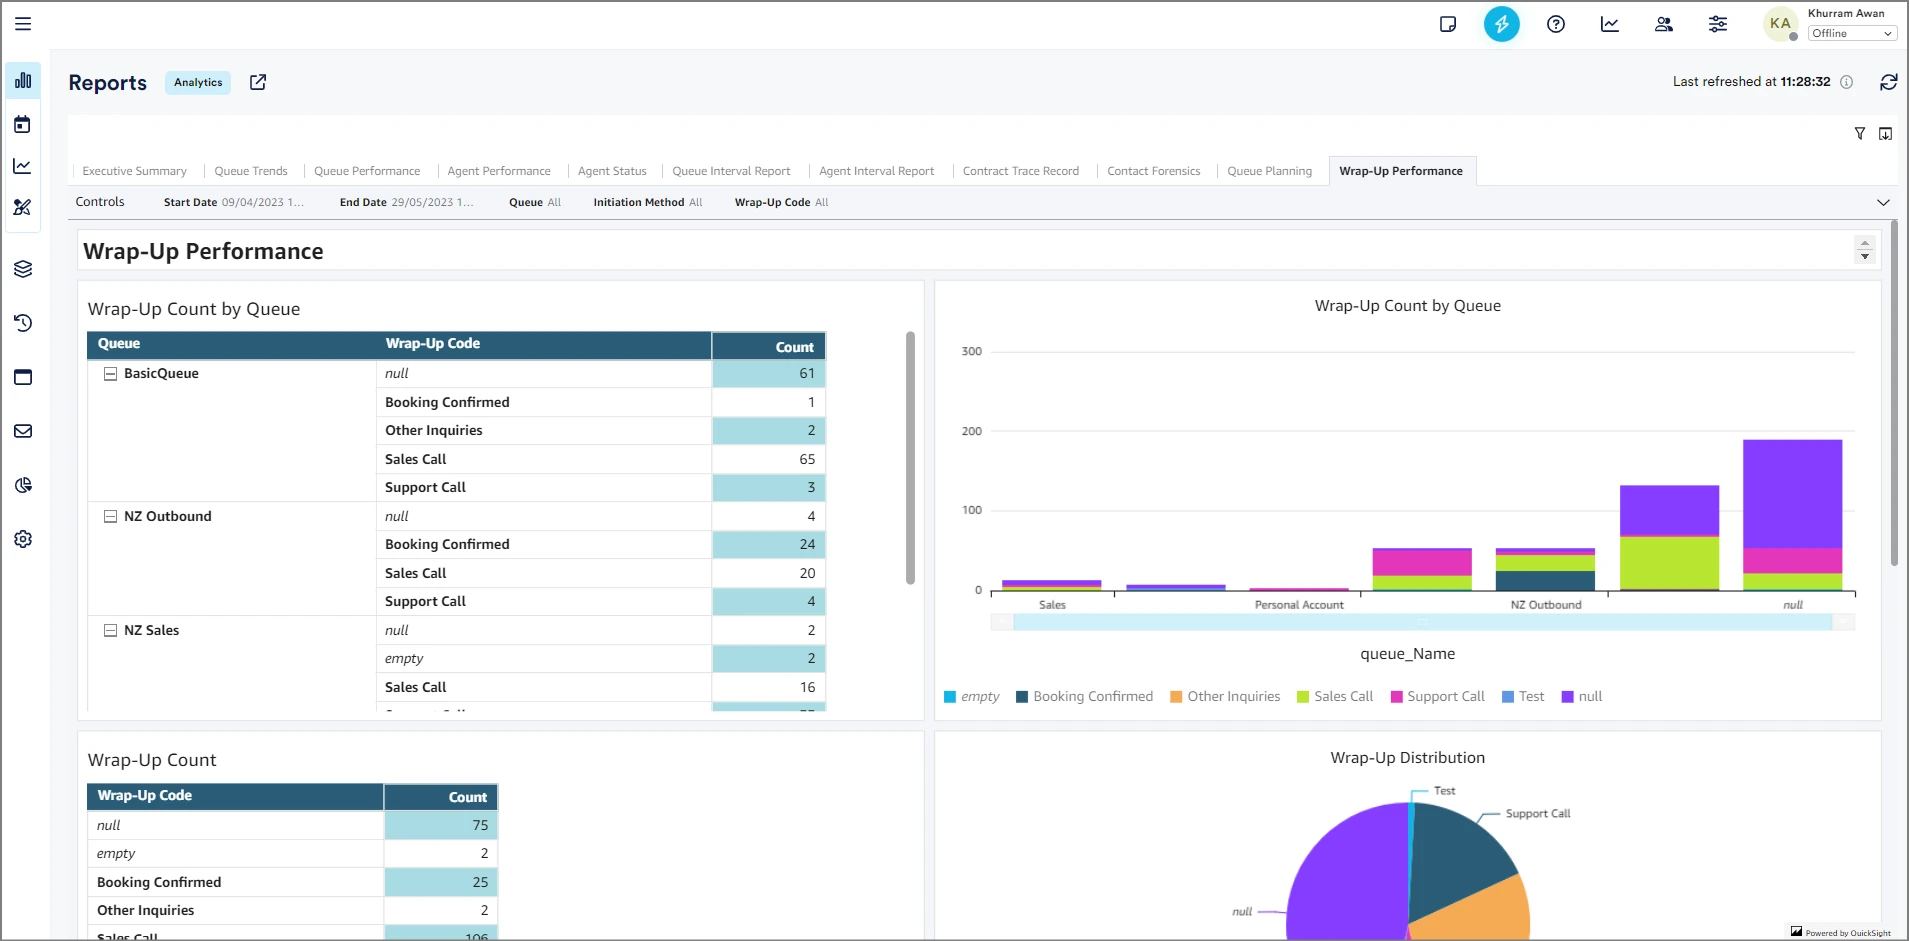
Wrap-Up Performance
Custom Reports
Custom reports can be created by selecting the Custom Reports button on the left-hand taskbar. This will open up a new tab to the Quicksight report portal.