Reporting & Dashboards
Reports are available within the NEONNOW softphone as an Enterprise feature "Insights". If enabled in your NEONNOW instance, this page provides an overview.
Note, additional reports will be available to admin users, detailed here (TBC).
Wallboard
The wallboard report is designed to give an impactful, real-time overview of the Contact Centre performance right now, as well as an overview of the current date.
It can be displayed in a contact centre on a large screen so all staff including floor walkers can view it.
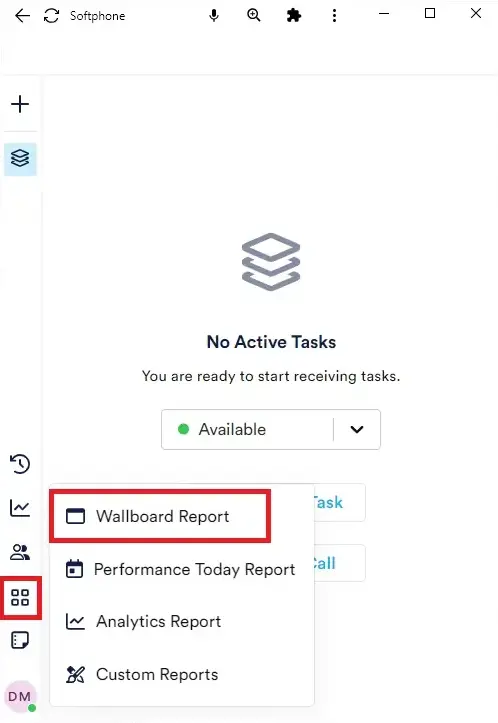
To load the Wallboard report, select the 'Desktop Shortcut' menu, then 'Wallboard Report'

This will open up a separate browser tab, displaying the Wallboard report. The following provides an overview of the Wallboard report.

The following provides an overview of the Wallboard Report elements and metrics. There are two tabs in the default Wallboard - 'Wallboard' and 'Service Level'.
'Wallboard' Tab
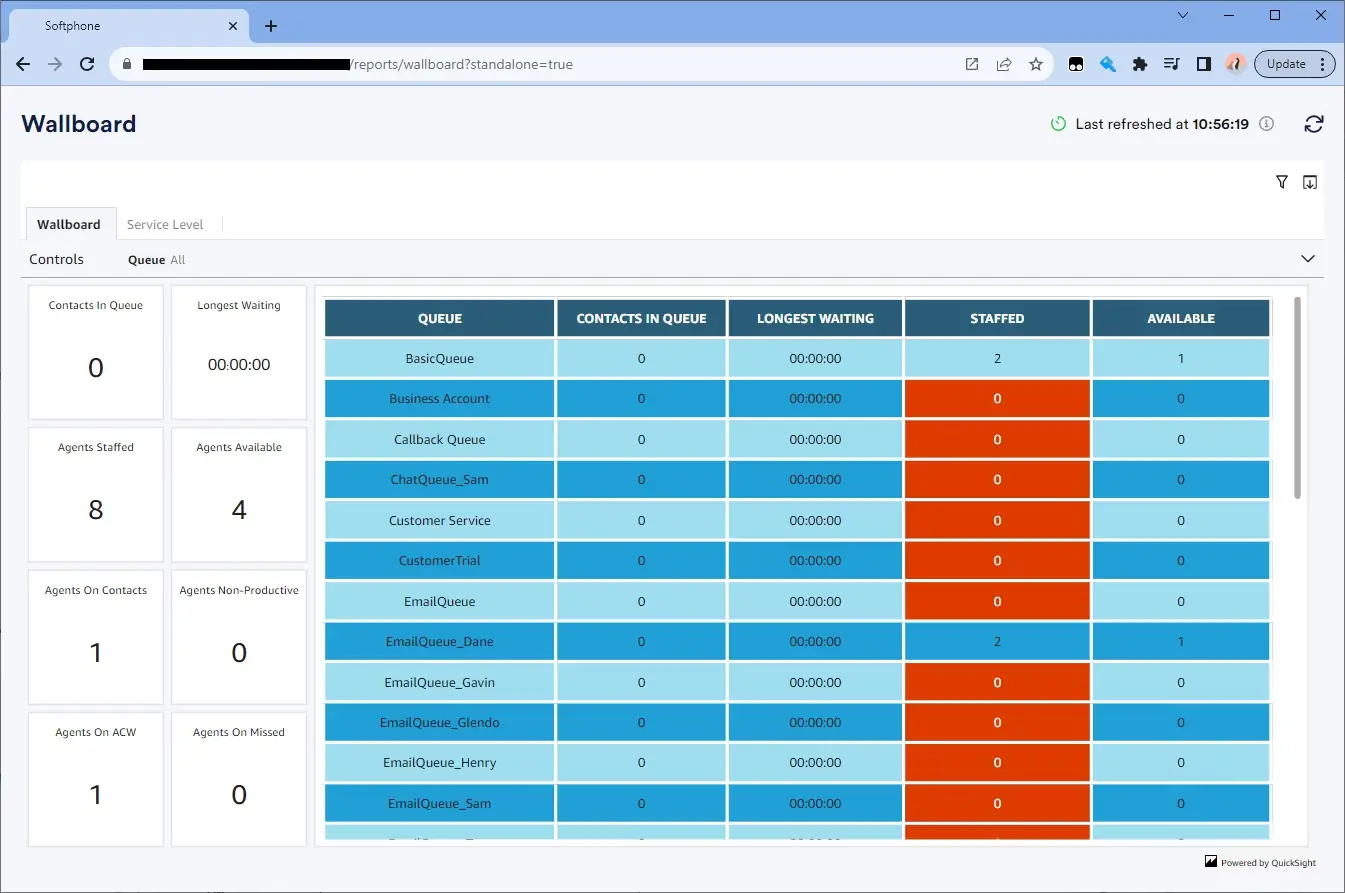
The 'Wallboard' tab is the main tab that appears in the Wallboard report.
Filter Section
The following filters can be applied to this report:
| Filter | Description |
|---|---|
| Queue | Name of the Queue(s) to filter across the whole report |
Summary Section
The following is a list of each field in this section and description of that field.
| Field | Description |
|---|---|
| Contacts in Queue | Number of Contacts waiting in the queue |
| Longest Waiting | The longest time that a contact spent waiting in the queue |
| Agents Staffed | Number of Agents who are online in the softphone, and not in NPT (a custom status) |
| Agents Available | Number of agents who can take an inbound contact. An agent can only take inbound contacts when they manually set their status to Available in the Softphone |
| Agents On Contacts | Number of Agents who are in currently on call with a contact |
| Agents Non-Productive | Number of Agents who are in a custom Status. |
| Agents on ACW | Number of Agents who are in the After Call work |
| Agents on Missed | Number of Agents who has missed a contact. |
Queue Detail Table
| Field | Description |
|---|---|
| Queue | Name of the Queue |
| Contacts In Queue | Count of contacts currently waiting in that queue. |
| Longest Waiting | Longest waiting time of a contact in that particular queue. |
| Staffed | Number of Agents who are online in the softphone and not in NPT in that queue |
| Available | Number of Agents who are in Available status ready to receive a call from the contact in that queue. |
'Service Level' Tab
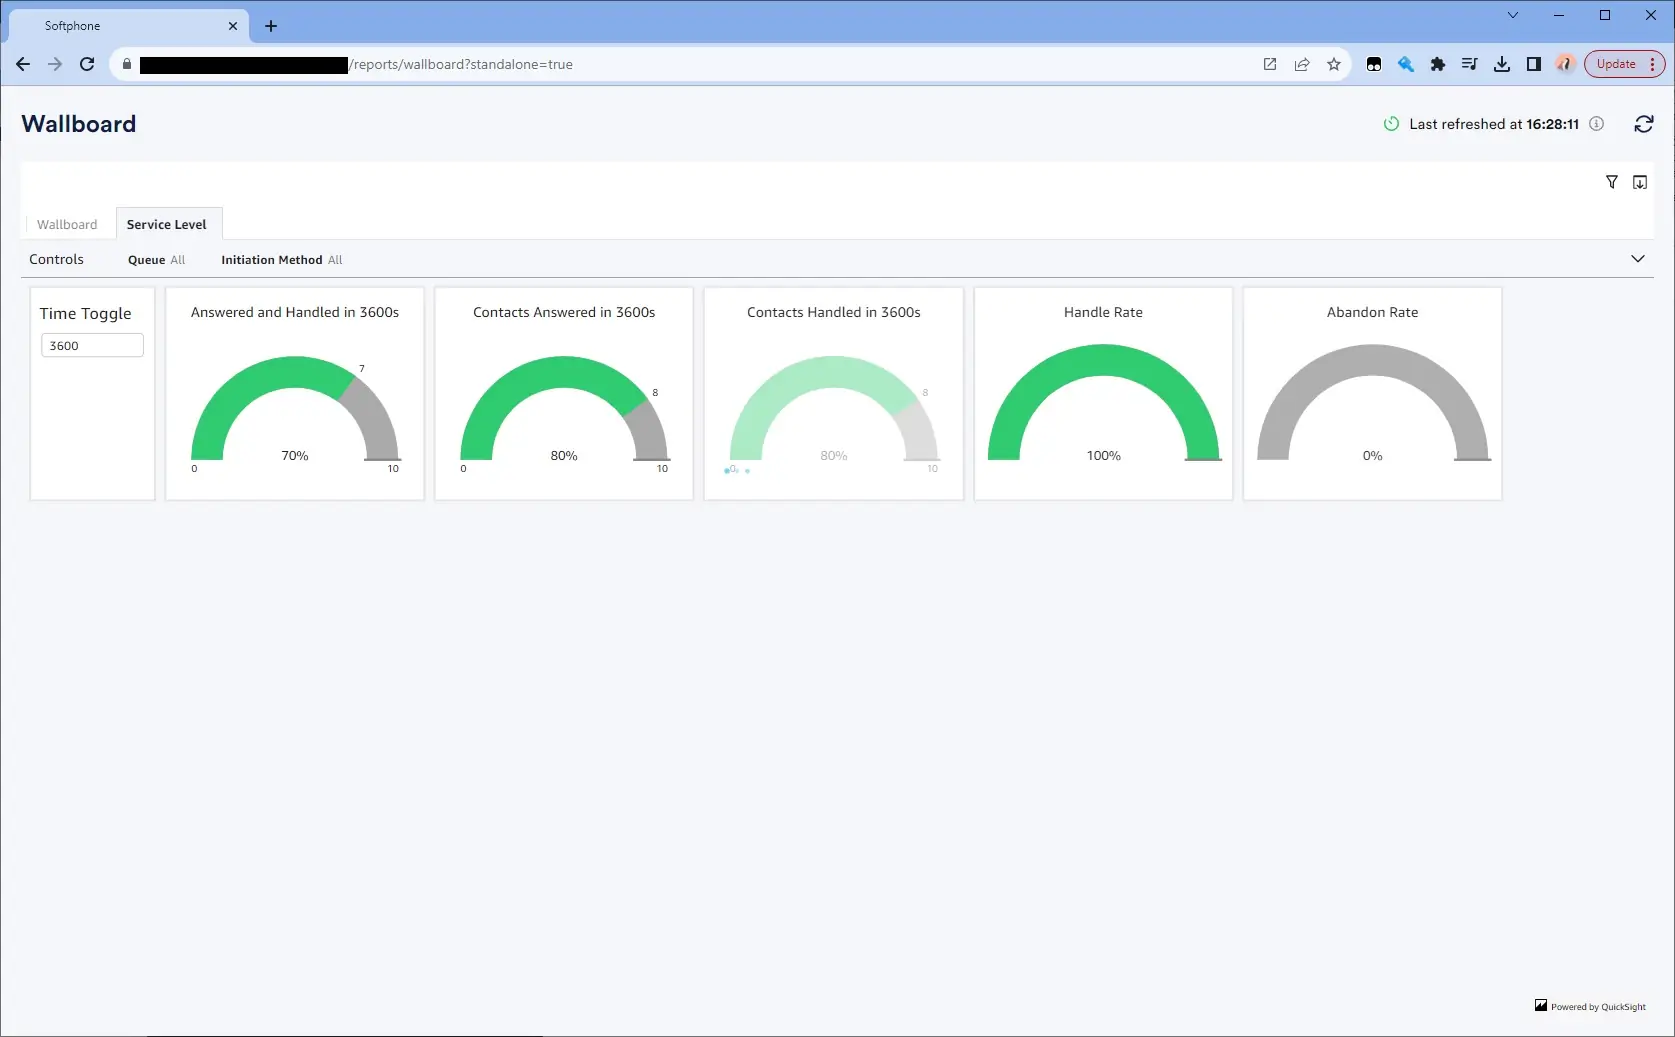
This report provides service level metrics for today i.e. since 12:00 AM to the point in time.
You can use Time Toggle to specify any number of seconds to customize the service level threshold.

Filter Section
| Filter | Description |
|---|---|
| Queue | Name of the Queue(s) to filter across the whole report |
| Initiation Method | Filter to select the type of method that initiated the interaction (i.e. Inbound,Outbound,Transfer,API etc) |
SLA Gauges
| Graphic/Field | Description |
|---|---|
| Time Toggle | This field can be used to modify the service level expected from the report |
| Answered and Handled in XXs | Number of Contacts answered and handled in the first XXs as per the configuration in the Time Toggle. It can be the sum of Contacts Answered and Contacts Handled. |
| Contacts Answered in XXs | Number of Contacts answered in first XXs as per the configuration in the Time Toggle. |
| Contacts Handled in XXs | Number of Contacts handled in first XXs as per the configuration in the Time Toggle. |
| Handle Rate | Number of Contacts successfully Handled within a specific XXs |
| Abandon Rate | Number of Contacts abandoned (Customer disconnected while waiting in the queue) within a specific XXs |